
🎬 Utilization rate walkthrough: the formula, the free calculator, why 2025 hit a record low, and why chasing 100% quietly kills your margin. Watch on YouTube
The Short Version
- Utilization rate = billable hours ÷ available hours × 100. It measures how much of the capacity you pay for actually turns into revenue, not whether that revenue is any good.
- Industry billable utilization fell to a record-low 66.4% in 2025, below the 70% floor most firms need to break even. This is a pipeline problem wearing an ops costume.
- 100% is a failure state, not a trophy. Push a team past 80% for a quarter and you buy burnout, missed upsells, and attrition, not margin.
- The lever that actually moves the number is bench-to-billable speed (time-to-match), not squeezing the people already billing. Idle hours are lost forever, so the fix is faster deal flow.
- Utilization without realization (the share of billable hours you actually collect on) is a vanity metric. Use the calculator below to price your own bench.
A senior developer on your team costs the same on a Tuesday whether they bill eight hours or zero. That single fact is the entire economics of an agency, and it is why utilization rate is the one number that quietly decides whether you keep the lights on.
In 2025 the professional-services industry posted its lowest billable utilization on record: 66.4%, per SPI Research's 2026 Professional Services Maturity Benchmark. Below we will unpack why the reflex fix (work the team harder) is the wrong one, and what actually moves the number.
Interactive Tool
Free Utilization Rate Calculator
Find your utilization rate, model your revenue ceiling, or price exactly what an idle bench is costing you.
Estimates for planning only, not financial advice. Health bands follow the 70–80% professional-services range with 72–80% treated as the sweet spot.
Your utilization rate is billable hours over available hours, and in 2025 it fell off a cliff
The formula never changes and every source agrees on it. Scoro, Kantata, and HiveDesk all write it the same way.
Simple to write, brutal to move. The number you feed into it is the share of the capacity you already pay for that turns into an invoice.
Billable utilization has now slid three years running to an all-time low of 66.4% in 2025, down from 68.9% the year before.
That utilization drop is not a rounding error. Saibon's analysis of the SPI data ties it directly to EBITDA falling from 15.4% to 9.8%, the worst in five years.
The mechanism is a spiral. Low utilization raises the cost baked into every billable hour, which compresses margin, which pushes firms to discount to win the next bid, which lowers revenue per head, which starves the budget for the tools and pipeline that would have fixed utilization in the first place.
The number you chase is a symptom. Your real problem is bench-to-billable speed
Every guide tells you to raise utilization by cutting internal meetings and tightening timesheets. That advice quietly assumes your people have billable work waiting and are simply choosing not to do it.
For most agencies that assumption is false. The gap is not laziness, it is an empty slot on the schedule, and an hour that goes unbilled today can never be sold tomorrow.
Saibon calls the primary driver of low utilization "time-to-match": how long it takes to move a person from available to billable on a real engagement. Shorten that window and utilization climbs on its own, no timesheet policing required.
Put a number on it. For a firm billing $1,200 a day, every consultant sitting two weeks on the bench burns roughly $12,000 in revenue that never comes back.
So the real question is not how to make billing people bill more. It is how fast you can put a paying project in front of the person who just freed up.
That is a demand-generation problem, and it is exactly where a steady, high-intent lead source earns its keep.
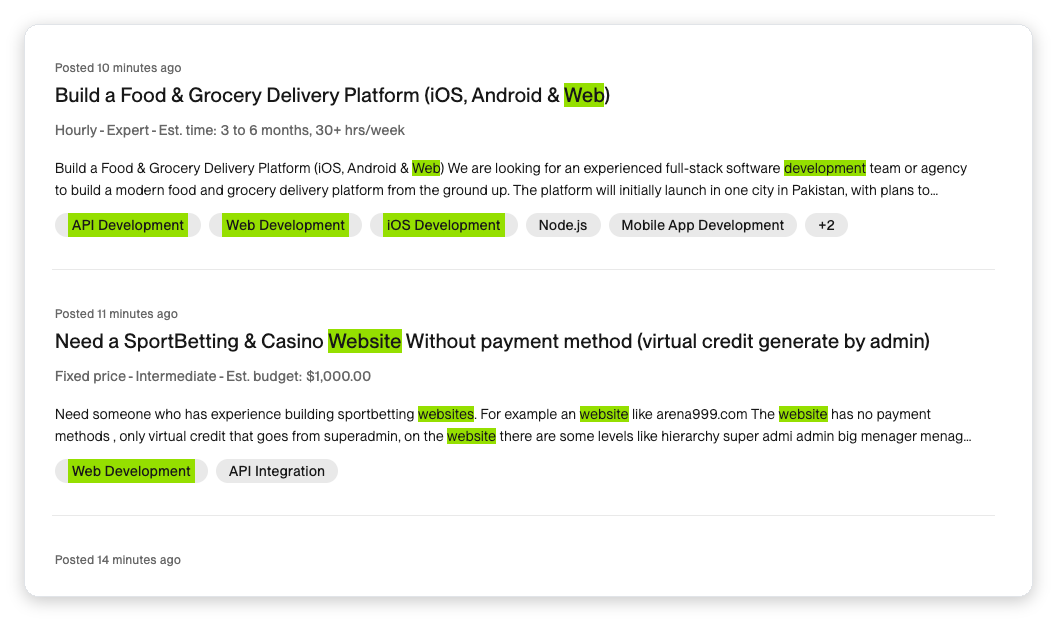
Upwork is the fastest bench-to-billable channel most agencies have, because the buyer already has budget and intent before you ever talk. That collapses the sales cycle that normally leaves people idle.
Our sales velocity guide shows how cycle length compounds into revenue, and the win rate calculator pairs with it.
100% utilization is a red flag, not a gold star
The instinct after seeing a low number is to sprint for the ceiling. That instinct destroys value, because the top of the range is where a firm starts eating itself.
Analysis of McKinsey's professional-services data is blunt: for every 5 percentage points you push utilization above 80%, voluntary attrition jumps about 12% the following quarter. You are not buying margin, you are borrowing it from next year's payroll bill.
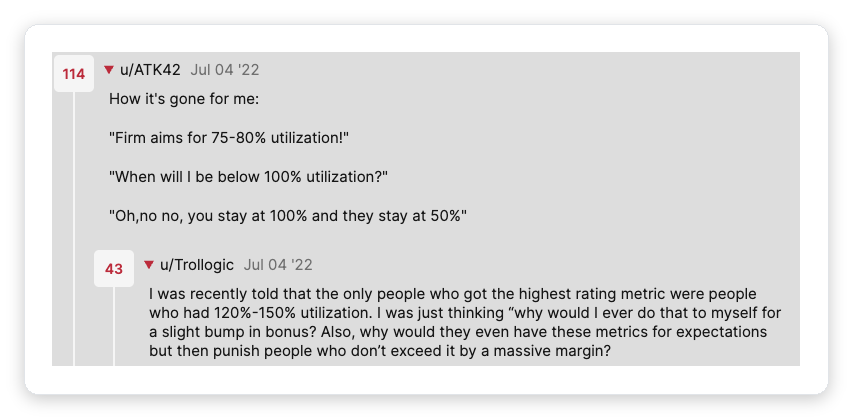
Practitioners feel this daily. In a widely upvoted r/consulting thread, the top comment lays out the real spread: firms target 75 to 80%, staff get pushed toward 100%, and the "top performers" quietly burn at 120 to 150%.
The fix is to stop reading utilization as one blended number and read it as a pyramid. The right target climbs for junior delivery staff and deliberately falls as you move up.
| Role | Target utilization | Why |
|---|---|---|
| Junior / delivery | 85–90% | Scoped execution work. Idle time here is pure margin leakage. |
| Senior / engagement lead | 70–75% | Bill them past this and they stop coaching, reviewing, and catching scope drift. |
| Strategist / account lead | 55–60% | High billable time here correlates with lower account lifetime value. |
| Director / partner | Below 45% | A partner billing 70% is your most expensive consultant, not a partner. |
Role staircase compiled from humanR and Scoro role benchmarks.
A blended 72% built from analysts at 88% and partners at 40% is a healthy firm. A flat 82% across every seat is a firm about to lose its best people.
Utilization without realization is a vanity metric
Here is the trap that flatters agencies into complacency. Your team can be 85% utilized and you can still be leaving a third of that money on the table, because utilization only measures whether hours got logged as billable, not whether you collected on them.
That second question is realization rate, and the two metrics measure different leaks. AccountingDepartment defines it cleanly.
| Metric | Formula | The leak it catches |
|---|---|---|
| Utilization rate | billable hours ÷ available hours | Capacity sitting idle on the bench |
| Realization rate | hours invoiced ÷ billable hours worked | Billable work written off, discounted, or eaten by scope creep |
Track one without the other and you optimize a shadow. A team pushed to 90% utilization that then writes off 25% of those hours to keep a client happy is less profitable than a calmer team at 75% that collects on everything it logs.
The two combine into the number that actually caps your business. Drivetrain frames it as a revenue ceiling.
What good looks like: 2026 agency utilization benchmarks
There is no single right number, which is exactly why blanket targets do damage. A creative shop at 65% is healthy while a dev shop at 65% is bleeding, so read your own lane.
| Agency / firm type | Typical range | Target |
|---|---|---|
| Creative / branding | 55–70% | 60–70% |
| Digital / PPC / SEO | 65–85% | 70–80% |
| Design / UX | 60–75% | 65–75% |
| Development / tech | 70–85% | 75–80% |
| Management consulting | 74–84% | 75–85% |
| Staffing / recruiting | 50–65% | 55–65% |
Ranges from Alto, Saibon, and HiveDesk. Treat them as calibration, not a target.
The payoff for closing even a modest gap is large. Alto puts a 15-point improvement in a 10-person agency at roughly £50,000 in added annual profit, and Saibon prices each single recovered point at €2,500 to €4,000 per person per year.
Free for Upwork agencies
Low utilization is a pipeline problem, not a willpower problem
GigRadar keeps your bench busy by running your Upwork pipeline through a real, human-supervised Business Manager, so a freed-up developer gets a qualified project in days instead of weeks.
Get Your Free Agency Audit →The five ways agencies quietly lose utilization points
None of these show up as a line item. They leak the number a point at a time until the quarter closes short and nobody can say exactly why.
A person rolls off a project and waits days for the next one. Every idle day is an unbillable hour you can never resell, so a fast, always-on pipeline matters more than any timesheet rule.
Blending partners, strategists, and analysts hides both the idle junior and the over-billed senior. Track utilization per role tier against the pyramid, not as a single firm-wide figure.
Hitting a high utilization number while writing off a quarter of those hours is a loss dressed as a win. Watch realization alongside it, or you are optimizing hours you never collect (AccountingDepartment).
Sustained high utilization buys attrition and quality drops, not margin. Hold a strategic bench of 10 to 15% so the team can train, upsell, and absorb the surprise escalation (Kantata).
Lumpy pipeline swings you between an overloaded team and an idle one, and both wreck utilization. A continuous lead source smooths the curve so capacity planning stops being a guess.
Take-home: a one-page utilization health check
Before your next capacity review, run the firm through these six checks. Copy the block, paste it into your ops doc, and treat any "no" as a fix, not a footnote.
UTILIZATION HEALTH CHECK
[ ] Utilization is tracked per role tier, not one blended number
[ ] Delivery staff sit 75-85%, seniors 70-75%, partners under 45%
[ ] No role runs above 85% for more than one quarter
[ ] Realization rate is tracked next to utilization
[ ] Time-to-match (bench to billable) is measured in days, not weeks
[ ] A 10-15% strategic bench is planned, not an accident
Pair the checklist with the calculator at the top. If your utilization sits in the danger band, the fastest fix is rarely a new timesheet policy, it is a faster way to put billable work in front of an idle team.
For the money model around it, our CAC calculator, break-even calculator, payback period calculator, and sales commission calculator close the loop from a busy bench to real profit.