
🎬 Sales Velocity Explained — the formula, the 2026 benchmarks, and why chasing more leads is the one lever that backfires. Watch on YouTube
TL;DR
- Sales velocity = (qualified opportunities × average deal value × win rate) ÷ sales-cycle length in days. The output is dollars of expected new revenue per day. Across 939 B2B companies the average is roughly $8,219/day.
- Doubling your average deal size usually does nothing for velocity, because bigger deals drag the sales cycle out by the same proportion. Every extra $10k of contract value adds 5 to 10 days to the close.
- The denominator is the cheat code. Cutting a 90-day cycle to 60 lifts velocity 50% by itself. Teams that hold cycles in the 30 to 45 day band run about 38% faster than everyone else.
- The one lever almost everyone pulls (more leads) is the one that quietly backfires: volume past your capacity drops win rate and lengthens cycles. Lead quality moves three of the four variables at once.
- Use the calculator below to find your own number, then see exactly which lever buys the most speed for the least effort.
A pipeline of 50 deals worth $50,000 each, closing at 25%, on a 45-day cycle generates $13,889 of new revenue per day. Double the deal size to $100,000 and let the cycle stretch to 90 days, exactly what happens when you move upmarket, and the number lands at $13,889 per day, identical.
That is the trap hiding inside sales velocity. The variable agency owners reach for first (bigger clients) often cancels itself out, while the variable they ignore (how fast a qualified deal closes) holds almost all the leverage.
This piece breaks down the formula, the benchmarks behind each input, and the one lever that pays back fastest. There is a calculator two scrolls down, so run your own pipeline before you read another opinion.
Free Interactive Tool
Sales Velocity Calculator
Enter your pipeline. Get your dollars-per-day, your annualized run-rate, and a side-by-side of which lever moves velocity most.
Which lever buys the most speed?
Run your numbers to see which single change adds the most dollars-per-day.
The formula, and the one input everyone gets wrong
Sales velocity compresses four pipeline drivers into a single number: how many dollars of new revenue your commercial engine produces per day. Gong, InsightSquared and the major revenue-ops benchmarks all use the same shape.
Run the average pipeline through it and you land near $8,219 of new revenue per day, the cross-company benchmark from Optifai's analysis of 939 B2B companies, where the median sales cycle clocks in at 84 days.
Here is the input that wrecks most calculations: the first box is qualified opportunities, not leads. Revenue-ops research and the old TOPO/Gartner playbooks are blunt about it.
Counting raw leads or marketing-qualified leads in the numerator deflates your win rate and inflates a velocity number that means nothing.
A deal only belongs in the count once it has cleared a real qualification bar: budget, an identified decision-maker, and a problem you can actually solve. Everything before that is noise that makes the math lie to you.
Win rate is won ÷ (won + lost), and leaving open deals in that denominator is the most common error in the whole formula. It quietly deflates your rate and makes every velocity comparison meaningless.
Why doubling your deal size often does nothing
The intuitive move is to chase bigger clients, and on paper twice the deal value is twice the velocity. In practice the cycle moves against you almost exactly as fast.
Benchmark studies put a number on it: every additional $10,000 of contract value adds roughly 5 to 10 days to the close, because bigger deals pull in more stakeholders. Gartner now pegs the typical B2B buying committee at 6 to 10 people, and up to 17 on complex enterprise deals.
Norwest's benchmark shows the same shape from the other side: deals under $25,000 average about 90 days to close, while deals over $100,000 routinely run six to nine months.
More signatures mean more delay, and more delay means a longer denominator.
| Scenario | Deal value | Cycle | Velocity |
|---|---|---|---|
| Baseline (20 opps, 25% win) | $60,000 | 90 days | $3,333/day |
| Move upmarket (2× deal, 2× cycle) | $120,000 | 180 days | $3,333/day |
| Hold deal size, cut cycle to 60 | $60,000 | 60 days | $5,000/day |
The upmarket play is a wash. The cycle play is a 50% gain with the same clients you already have.
None of this means large deals are bad. It means a pipeline dominated by big, slow-moving opportunities can deliver lower velocity and more cash-flow volatility than a tighter book of mid-size deals that close fast.
Velocity measures new revenue speed, not whether it sticks, so pair it with net revenue retention before you celebrate. And read your own sales pipeline stages before you blame your stage gates for stalling deals.
The denominator is the cheat code: shorten the cycle
Because cycle length sits in the denominator, shrinking it has an outsized effect. A 10% shorter cycle is a 10% velocity gain on its own, before any compounding from less deal slippage.
And slippage is brutal. Ebsta and Pavilion, analyzing 4.2 million opportunities and $54B of pipeline, found that win rate drops 67% once a deal slips past eight weeks.
Speed is not just efficiency. It protects the win rate too.
Teams that deliberately hold their cycles in the 30 to 45 day range run roughly 38% higher velocity than slower peers, even when that discipline means slightly smaller average deals. The fastest GTM teams close about three times quicker than average and capture roughly 80% of the revenue in their markets.
Win rate is the most sustainable lever, and lead quality drives it
Among the three numerator inputs, win rate is the one most under your control and the one with the most room to run. Average B2B win rates fell from 29% in 2024 to about 19% in 2025, yet top teams still close above 30%, and some segments run higher still.
That gap is a 50%+ velocity difference between average and best-in-class, with no change in lead volume.
And the single biggest predictor of which side of that gap you land on is fit. The same Ebsta and Pavilion dataset is unambiguous about it.
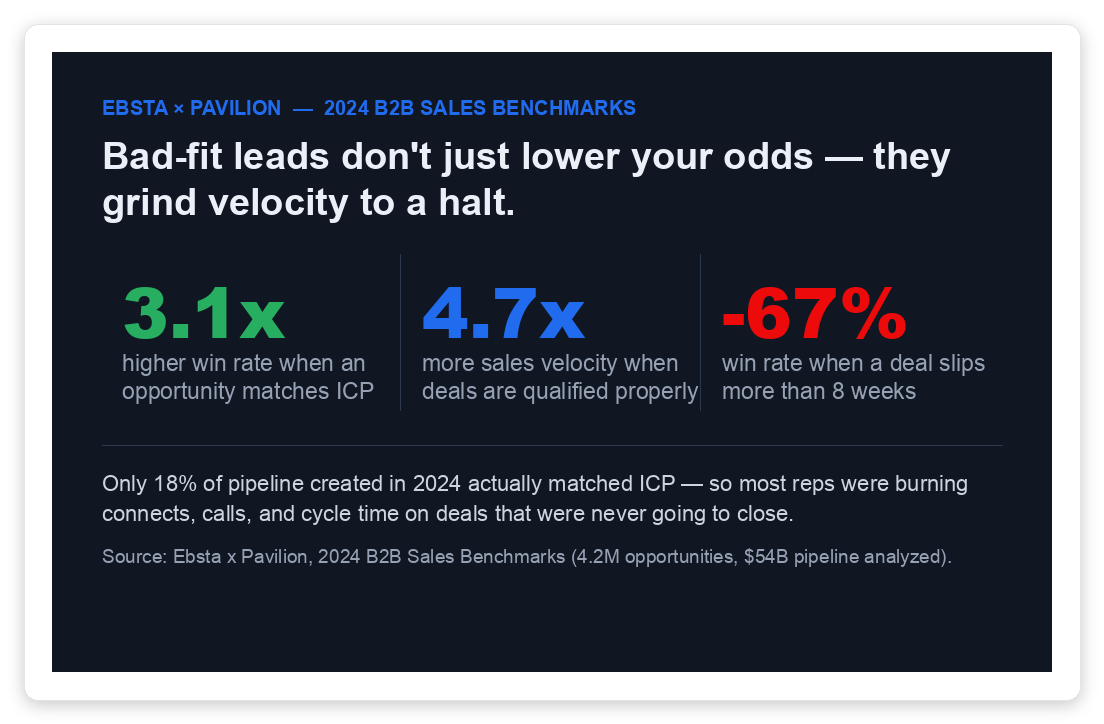
Now connect the dots. Win rate, cycle length, and deal slippage are all downstream of one thing: how well-fit the opportunity was when it entered the pipeline.
A poorly-matched deal stalls, drags in extra stakeholders, and dies at the proposal stage. A well-matched one moves.
Naming the competition early adds another 49% to your close odds, per Gong. But you only get that chance if the deal was real to begin with.
This is why lead quantity is the lever that backfires. Past your team's capacity, more leads mean slower follow-up, shallower qualification, and more deals left to slip.
The funnel is already leaky (only about a fifth of qualified opportunities are won on average), so flooding the top with marginal-fit prospects lowers win rate and lengthens cycles at the same time. Quality at the top moves three variables in your favor at once.
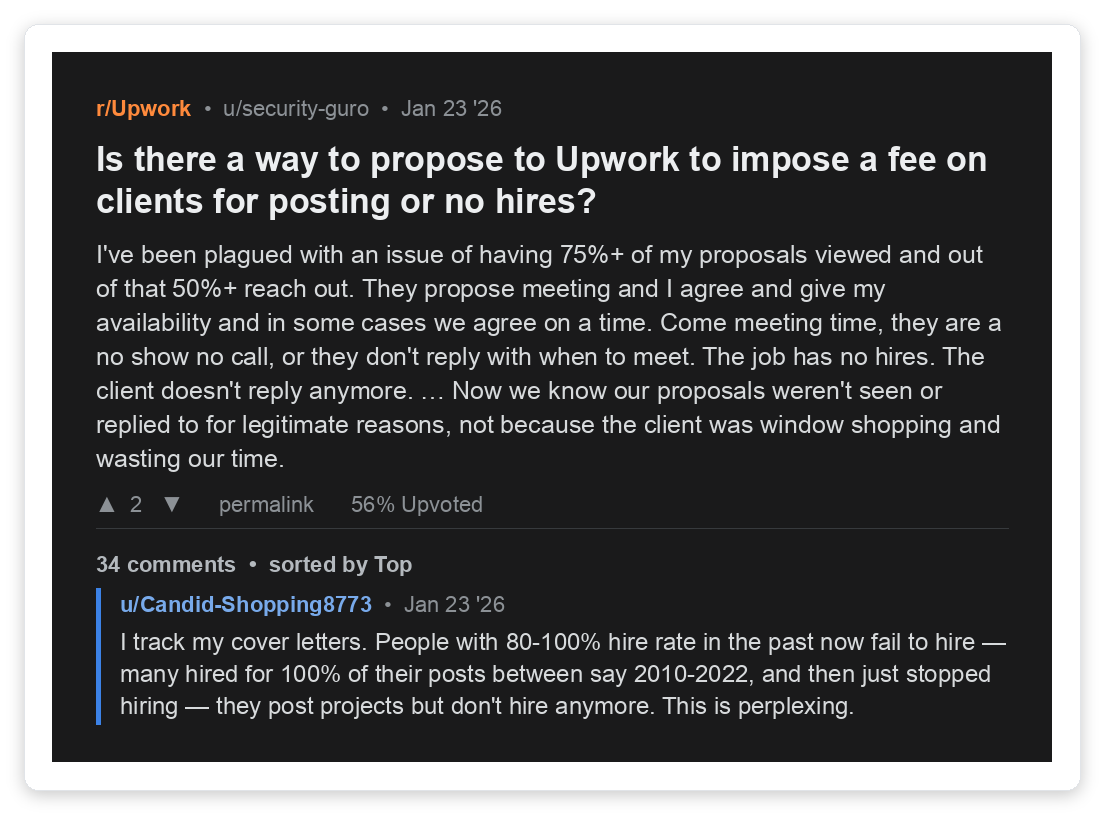
What this means if your pipeline runs through Upwork
For an Upwork agency, the sales cycle does not start at the discovery call. It starts the moment you spend a Connect on a job post.
Every bad-fit bid is an opportunity you just added to the numerator that will never close. It drags your real win rate down and stretches your average cycle while you wait on replies that never come.
Most agencies try to fix soft revenue by bidding on more jobs. That is the volume lever, and on Upwork it backfires the same way it does everywhere else.
Connects burned on the wrong jobs inflate your opportunity count with deals that crush win rate. The fix is fit, not frequency.
Client hire history, verified payment, budget, and how close the brief is to your best past wins. A bad-fit bid is a future loss you are paying to add to your pipeline.
Early decision-maker contact is worth a 55% lift in win rate. On Upwork that means prioritizing clients who actually open chats and respond, not ghost listings.
A same-day, well-matched proposal beats a polished one sent three days late. Slippage at the bid stage is still slippage.
This is exactly where GigRadar fits. We operate a real Upwork Business Manager account that your agency invites through Upwork's official invitation system, the same role you would use to onboard a hired bidder.
Proposals submit from our BM under our team's supervision, not through the unofficial Upwork API or a browser bot. Your own freelancer account is never touched, and every bid is filtered for fit first.
Fewer, better-matched opportunities is the lead-quality lever, applied at the exact point where your sales cycle begins. Pair it with the right Upwork automation model and the velocity math starts working for you instead of against you.
Free for Upwork agencies
Stop adding losses to your numerator
GigRadar filters every Upwork job for fit before a Connect is spent, so your pipeline fills with deals that actually close. Higher win rate, shorter cycle, faster velocity.
Get Your Free Agency Audit →Five ways agencies miscalculate sales velocity
Before you trust your number, rule out the five errors that turn this metric into fiction. They are ordered by how often they ruin the math.
-
1
Counting raw leads as opportunities. The numerator is qualified opportunities only. Stuff it with MQLs and your win rate and velocity both lie.
-
2
Leaving open deals in the win-rate denominator. Win rate is won ÷ (won + lost). Include still-open deals and you deflate the rate every time.
-
3
Averaging across wildly different deal sizes. A $5k retainer and a $150k build do not belong in the same average. Segment by deal band or the blend is meaningless.
-
4
Measuring over a window shorter than one cycle. If your cycle is 90 days, a 30-day read ignores most open deals and reports noise. Use rolling quarters.
-
5
Treating the four variables as independent. They trade off. Push volume and win rate drops. Chase deal size and the cycle stretches. Model the second-order effect or you will optimize the wrong lever.
Recompute velocity by deal-size band and by lead source, the same discipline behind a healthy sales plan. The blended number tells you how fast you are going; the segmented numbers tell you which channel and deal size are actually pulling their weight.
Run your own number, then pull one lever
Sales velocity is not a vanity metric. It is a forecasting tool and a diagnosis.
Computed honestly (qualified opportunities, closed-deal win rate, one cycle window) it tells you whether your pipeline is a fast, predictable engine or a bloated one burning cash on deals that will not close.
The benchmarks all point the same way. Volume is the lever that fights itself, deal size is the lever that cancels itself.
Cycle speed and win rate, both driven by lead quality, are where the durable gains live. Scroll back up, run your pipeline through the calculator, change exactly one input, then go make that one true.