
Net revenue retention in two minutes — why the 120% benchmark is a myth, NRR vs GRR, and how to find your real number. Watch on YouTube
TL;DR
- Net revenue retention measures how much recurring revenue a fixed cohort of existing customers keeps and grows over 12 months, with new customers excluded. Above 100% means the base expands on its own.
- The "good NRR is 120%" target is an enterprise number. The median for private B2B SaaS sat at 101% in 2025, down from roughly 117% in 2021 (Benchmarkit, SaaS Capital).
- A high NRR with a low gross retention floor is a churn problem wearing a disguise: a few expanding accounts mask a base that is leaking. Track the NRR-to-GRR gap, not NRR alone.
- Use the calculator below to get your NRR, your GRR, and the exact dollars of new revenue you need every month just to stand still if you are under 100%.
- Agencies have an NRR too. Every retainer downgrade is contraction and every offboarded client is churn. Most run sub-100% and fund the gap with exhausting new-business hustle.
The median private B2B SaaS company kept 101 cents of every recurring dollar from its existing customers last year, and that number has fallen every year since 2021. Net revenue retention is the metric that exposes whether your growth is compounding or just replacing what quietly leaked out the back.
Most teams quote a benchmark they read in a deck (120%) and never compute their own. The two facts collide badly: you are measuring yourself against the top quartile of enterprise software while sitting in a segment where 100% is a good year.
This is the number investors weight above almost everything else, because it predicts growth more reliably than logo count. Compute yours first, then unpack what it actually means.
Find your real NRR (and the GRR hiding underneath it)
Enter one cohort's numbers: the recurring revenue those customers paid you at the start of the period, then what that same group did over the next 12 months. Do not add a single new customer who signed during the year.
Interactive Tool
Net Revenue Retention Calculator
Gross and net retention, your percentile verdict, and the stand-still math if you are under 100%.
Benchmarks: SaaS Capital 2025 retention survey and Benchmarkit 2025. Verdict compares your NRR to the published median and top quartile for the segment you picked.
If your NRR came in under 100%, the stand-still line is the part that should sting. Every month you are paying acquisition costs to refill a bucket that is draining, and none of that spend shows up as growth.
What net revenue retention actually measures
Net revenue retention is the percentage of recurring revenue you keep from a fixed group of existing customers over a period, usually 12 months. It folds in expansion (upsells, cross-sells, seat additions, price increases) and subtracts contraction (downgrades) and churn (cancellations).
The defining trait: it can exceed 100%. SaaS Capital defines it cleanly as December 2024 MRR from customers who existed in December 2023, divided by total MRR in December 2023 (SaaS Capital, 2025).
Work a real example. A cohort starts at $50,000 MRR, expands by $9,000, gives back $3,000 in downgrades, and loses $7,000 to cancellations.
$50,000 is what these specific customers paid at the start. New logos that signed during the year are invisible to this calculation.
50,000 + 9,000 - 3,000 - 7,000 = $49,000 ending MRR from the same group.
NRR = 49,000 / 50,000 = 98%. GRR = (50,000 - 10,000) / 50,000 = 80%. The base shrank 2% on net, but you actually lost 20% before expansion bailed you out.
That 98% looks survivable. The 80% GRR underneath it is the real story, and it is the number most dashboards bury.
Stripe frames the stakes plainly: acquiring a new customer costs 5 to 25 times more than keeping one (Stripe).
The 120% benchmark is an enterprise lie
The single number you have heard quoted as "good" almost always comes from a public, enterprise-heavy software company. For the median private B2B SaaS company, it is wrong by 15 to 20 points.
Benchmarkit's 2025 survey put median NRR at 101%, and flagged that gross retention has slid from 90% to 88% over three years (Benchmarkit, 2025). The headline has been compressing every year since the 2021 peak.
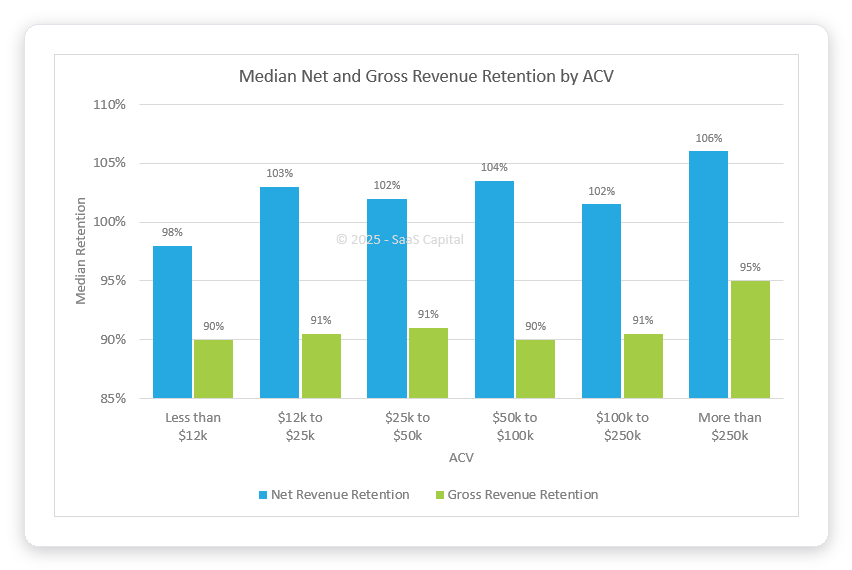
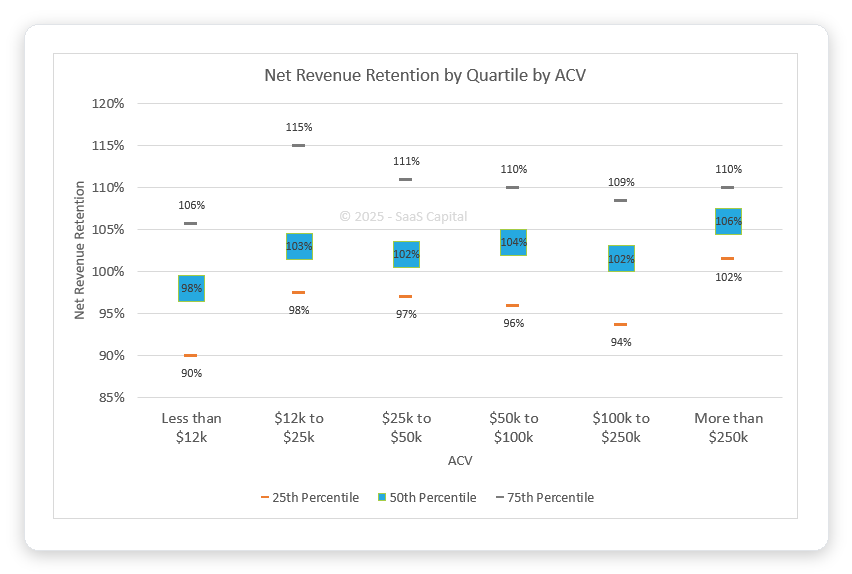
The bigger problem with one blended number: it hides a 20-point spread driven almost entirely by contract size. Retention rises with average contract value, because larger accounts have more seats and modules to expand into.
| Segment | Median NRR | Top quartile | Typical GRR floor |
|---|---|---|---|
| SMB / self-serve (ACV < $25k) | ~97% | ~111% | 85%+ |
| Mid-market ($25k–$100k ACV) | ~102% | ~111% | 88%+ |
| Enterprise (ACV > $100k) | ~118% | 130%+ | 90%+ |
SaaS Capital publishes the $25k–$50k ACV band most precisely: 102% median, 111% top quartile, 97% bottom quartile (SaaS Capital, 2025). Enterprise figures are directional from blended industry reporting.
For bootstrapped companies between $3M and $20M ARR, the picture is steadier: median NRR 103%, with the 90th percentile reaching 117.9% and median GRR at 91% (SaaS Capital, 2026).
A 103% there is not mediocre. It is the median, and the median is a fine place to operate from.
Why a high NRR can hide a dying business
NRR is a single net number, and netting is where the lie lives. One whale account tripling its contract can drag the whole figure above 100% while half your smaller customers walk out the door.
This is the gap that matters: NRR minus GRR. Gross retention strips out all expansion and shows only what you lost, so it can never exceed 100%: the floor under your business (Gainsight).
SaaS Capital's data shows why investors obsess over this: moving NRR from the 90–100% band into 100–110% lifts the median growth rate by 5 points, and the highest-NRR companies grow 83% faster than the population median (SaaS Capital growth benchmarks). Retention compounds in a way new logos never do.
For every 1% increase in revenue retention, a SaaS company's value rises about 12% after five years, per SaaS Capital research (via ChurnZero). NRR is not a vanity metric. It is a valuation input.
The five ways teams inflate NRR by accident
Most reported NRR numbers are quietly wrong, and almost never on purpose. The formula is simple enough that the errors hide in what you include rather than the arithmetic.
The most common inflation. New logos that signed during the period belong nowhere in NRR. Mixing them in turns NRR into a disguised growth rate.
A net number with no floor next to it is unreadable. Always publish the pair so the gap is visible.
Taking one strong month and multiplying out smooths over seasonality and renewal cliffs. NRR is a trailing-12-month or cohort number, not a snapshot.
When a single account is 30% of revenue, its renewal swings NRR more than everything else combined. Segment it out and report the rest separately.
A 97% NRR is a crisis for an enterprise vendor and roughly par for an SMB one. Benchmark inside your ACV band or the number means nothing.
Your agency has an NRR even if you have never calculated it
Net revenue retention is filed under SaaS, but any business with recurring revenue has one. If your agency runs on monthly retainers, you have an NRR, and most owners have never computed it.
The mapping is direct. A client who bumps their retainer or adds a service line is expansion.
A scope cut is contraction. An offboarded client is churn.
Net those across last year's clients and you have your number.
"We added 11 new retainer clients last year and our revenue was basically flat. Took me way too long to realize we were losing them just as fast out the back."
Paraphrased from a recurring complaint in agency-owner communities
That is a sub-100% NRR described in plain language. The agency is on an acquisition treadmill: new clients refill the bucket while old ones drain it, and the team mistakes motion for growth.
The fix is sequencing. Plugging the leak comes first, because every point of retention you recover makes every new client worth more.
We wrote the playbook for that in client retention strategies, and the recurring-revenue mechanics carry over from the MRR calculator and service productization.
Pouring acquisition on top of a leaky base is the most expensive mistake an agency makes. If your NRR is under 100%, new business does not compound. It replaces.
Free for Upwork agencies
Stop funding churn with exhausting new-business hustle
Once your retention floor is solid, the acquisition side should be efficient, not frantic. GigRadar fills your Upwork pipeline with scored, payment-verified jobs so new revenue compounds on top of a base that holds.
Get Your Free Agency Audit →How to actually move the number
NRR is a lagging indicator, so by the time a bad quarter shows up the damage is months old (Amplitude). You move it by fixing the inputs ahead of the renewal, not by staring at the output.
Defend the floor before chasing the ceiling
Gross retention is the cheapest point to win. Find the two or three churn reasons that repeat, and kill those first. Every recovered GRR point drops straight into NRR.
Build a real expansion path
Expansion needs somewhere to go: a higher tier, an add-on, more seats, a usage line. If your pricing has no next step, your NRR is capped near 100% by design.
Catch risk before the renewal date
Usage drops and quiet accounts predict churn weeks ahead. Pair NRR with leading signals so you act before the cancellation, not after it lands in the report.
Run your numbers through the calculator at the top once a quarter, segment by ACV, and watch the gap between net and gross. That pair, tracked over time, tells you more than any benchmark deck.
For the broader picture of where recurring revenue comes from, the automated lead generation and value proposition playbooks connect the acquisition and expansion sides.
The median is 101% and falling. If you are above it, defend the lead.
If you are below it, you already know which bucket to plug first, and now you know exactly how many dollars a month the leak is costing you.