Sales KPIs in 2026: Track One Metric, Not Fifteen
Sales KPIs in 2026: Track One Metric, Not Fifteen. A 2-minute walkthrough of the one composite KPI that runs your sales org. Watch on YouTube
TL;DR
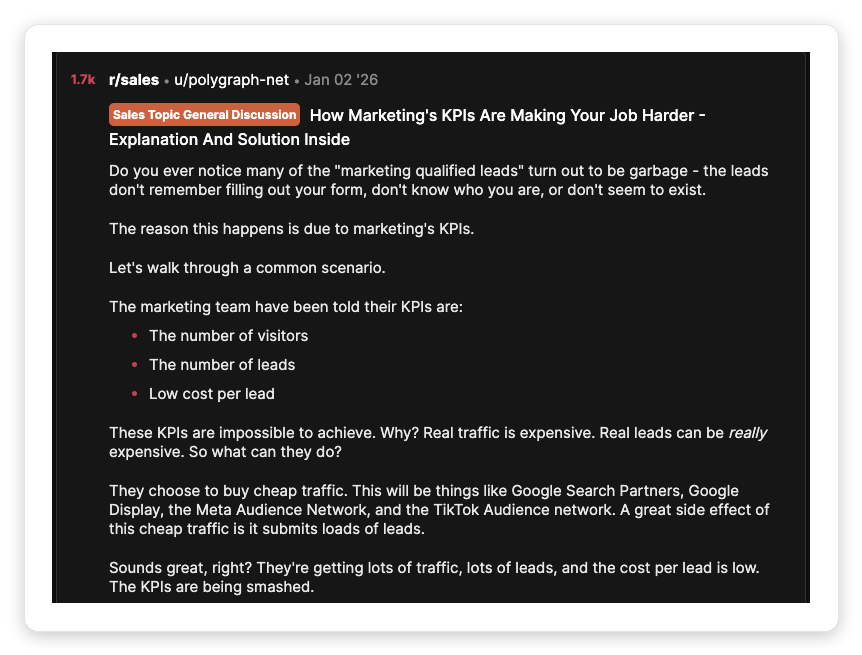
- Average B2B win rates fell from roughly 29% to about 19% between 2024 and 2025, and cycles stretched to 6.5 months. The fix is not more dashboards.
- Sales velocity ((opportunities × deal size × win rate) ÷ cycle length) is the one composite KPI that moves when any of the four levers that matter move. Everything else is a diagnostic.
- Quota attainment is a lagging story built on a number you invented last year. Activity metrics (calls, emails, proposals sent) get gamed the day they hit a dashboard.
- The "average win rate" benchmark hides the segment where you close 40% and the one where you close 4%. Always segment before you benchmark.
- For agencies whose pipeline starts on Upwork, reply rate is the earliest leading indicator. GigRadar pipeline data shows it swings from 6.7% to 18.5% on proposal quality alone.
- Use the free sales velocity calculator below to model which lever gives you the biggest lift.
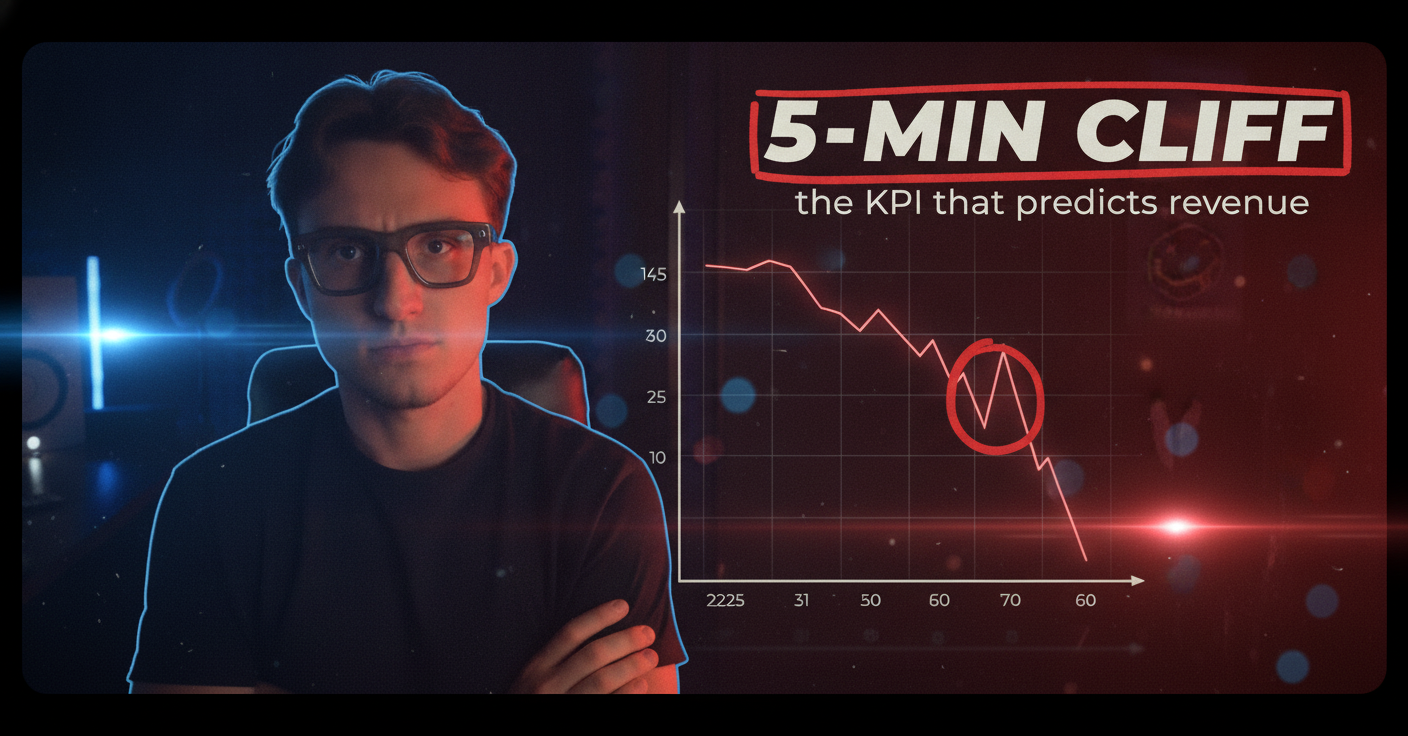
The average B2B win rate dropped from around 29% in 2024 to roughly 19% in 2025, sales cycles stretched past 6.5 months, and quota attainment hit multi-year lows. The reflex across most sales teams was to add more KPIs to the dashboard.
That reflex is the actual problem. A 15-metric dashboard is not rigor: it is the absence of a decision about which number runs your business.
This guide does the opposite of the generic listicle. It names the one composite KPI worth putting at the center, the formulas behind it, the 2026 benchmarks to measure yourself against, and the metrics that are actively lying to you right now.
The one number that moves when anything real moves
Sales velocity is the only KPI that reacts to all four of the levers that actually change revenue: how many qualified opportunities you have, how big they are, how often you win, and how fast they close.
The formula, as used across HubSpot's community and ORM-Tech's pipeline analysis, is simple:
Its power is that it forces the trade-off conversation a shopping list lets you dodge. Chasing bigger deals feels like progress, but if it lengthens the cycle it can quietly lower your velocity.
Reduce cycle length by 20% with everything else held constant, and velocity rises 25% automatically, because the denominator shrinks. Model that trade-off for your own numbers here.
Free Interactive Tool
Enter your pipeline numbers. See revenue-per-day, a benchmark health check, and which lever moves velocity most.
Quota attainment is a lagging story, not a KPI
Quota attainment measures reps against a number you invented last year, based on a market that no longer exists. When win rates fell and cycles stretched past 6.5 months, attainment cratered for reasons no rep controls.
HubSpot's State of Sales data shows only about 60% of teams are on track to hit their targets, while Gradient Works reports attainment at multi-year lows. When most of a team misses quota, the quota is the thing that broke.
Attainment is a lagging indicator: by the time it moves, the quarter is already decided. Use it to grade the past, never to steer the present, and always pair it with win rate, cycle length, and pipeline coverage so you can see why it moved.
Every activity metric becomes a target the day it hits a dashboard
Put "proposals sent per week" on a dashboard and you will get proposals sent per week: 40 of them, copy-pasted, aimed at nothing. This is Goodhart's Law with a commission plan attached: the moment a measure becomes a target, it stops measuring anything.
GigRadar's own pipeline data proves the cost. Across 133,872 outbound Upwork proposals (December 2025 to February 2026), reply rate swung from 6.7% for the worst-quality band to 18.5% for the best: a 2.75x spread a "volume sent" number renders completely invisible.
Count outcomes per unit of effort, not raw effort. A rep can hit an activity quota while the pipeline behind it is dead.
The KPIs that actually matter, in priority order
You do not need fifteen. Instrument these six, in this order, and delete the rest, because each one either steers behavior this week or diagnoses why velocity moved.
The north star: revenue per selling day. It moves when any real lever moves.
Closed-won ÷ (closed-won + closed-lost), split by source and deal size. Never blended.
Days from opportunity creation to closed-won. The cheapest velocity lever to shorten.
Qualified pipeline ÷ revenue target. Aim 3–5x, tuned to your win rate.
Expansion minus churn on your existing base. Above 100% means growth without new logos.
The earliest signal that next quarter's pipeline exists. For Upwork agencies, that is reply rate.
Here is what "good" looks like for each in 2026, so you can benchmark honestly.
| KPI | 2026 benchmark | Source |
|---|---|---|
| Win rate | ~19–21% avg; 30%+ = top quintile | Ebsta x Pavilion / Gradient Works |
| Sales cycle | ~84-day median; 6.5 mo avg overall | ORM-Tech / Optifai |
| Pipeline coverage | 3x at 33% win rate; 4x at 25% | Saber |
| Quota attainment | ~60% of teams on track | HubSpot State of Sales |
| Net revenue retention | ~106% median; 120%+ = top tier | Userlens / SaaS Capital |
| CAC payback | under 12 months = efficient | ScaleXP |
These are cross-industry medians from Ebsta x Pavilion, Saber, and ScaleXP, so read them against your own segment rather than as absolutes. A slight deviation is noise, not a diagnosis.
Leading versus lagging: why your dashboard shows you the past
Salesforce draws the line clearly: leading indicators (meetings booked, top-of-funnel conversion) can be influenced in near real time, while lagging indicators (total sales, quota attainment, NRR) report a decision already made.
Most dashboards are 90% lagging, which is why they feel like a rear-view mirror. High-performing teams deliberately blend the two so they can adjust mid-quarter instead of autopsying at the end of it.
- Top-of-funnel reply / conversion rate
- Meetings booked
- Stage-to-stage progression
- Pipeline coverage ratio
- Quota attainment
- Total closed revenue
- Net revenue retention
- CAC payback period
If you can only add one number to your dashboard this quarter, make it a leading one, because it is the only kind you can still do something about. For deeper reading, see our breakdown of sales velocity and how it connects to your sales pipeline stages.
For agencies whose pipeline starts on Upwork, reply rate is the earliest signal
The "average win rate is 21%" benchmark is worse than useless, because your blended average hides two segments: the source where you close 40% and the one where you close 4%. The average tells you to fix neither.
Win rate is also lagging. By the time it moves, the deal is months old.
For a pipeline that begins as Upwork proposals, the real leading indicator is reply rate. It tells you today whether next quarter's pipeline will exist.
Almost no agency actually tracks it, because the data is smeared across fifty browser tabs and freelancer inboxes. A number you cannot see is a number you cannot manage, so agencies fly on win rate: the one KPI that is already too late to change.
This is the specific gap GigRadar closes: every Upwork proposal your team sends flows through one place, so reply rate, view rate, and client-quality signals become a live leading indicator instead of a guess. That clean top-of-funnel data is what makes the velocity math downstream trustworthy.
Free for Upwork agencies
Instrument the one leading KPI you're flying blind on
See your Upwork reply rate, view rate, and client-quality signals in one live dashboard, so your sales velocity math is built on real pipeline data.
Get Your Free Agency Audit →Build your KPI stack this week
You do not need a new tool to start. You need to delete eleven metrics, instrument four inputs, and follow this order of operations.
Agree on when an opportunity is "created" and when a deal is "won." A cycle measured from first touch versus opportunity creation differs by weeks.
Opportunities, deal size, win rate, cycle length. Segment win rate by source from day one.
The earliest signal for your channel. Reply rate for Upwork, meetings booked for outbound, MQL-to-SQL for inbound.
You need a stable baseline before a benchmark means anything. Then compare against segment, not the blended average.
Run your own numbers through the velocity calculator above, then pair it with the CAC calculator, ARR calculator, and our guide to net revenue retention to complete the picture. For a qualification framework that keeps win rate honest, MEDDIC is the standard.
Pick the one metric that changes your behavior this week (sales velocity), instrument its four inputs plus one leading indicator, and delete the other eleven. A KPI you do not act on is not a KPI: it is decoration.