
TL;DR
- Quota attainment is (actual ÷ quota) × 100, and 43.6% of B2B reps cleared their number last quarter across 252 software companies (RepVue Cloud Sales Index, Q2 2026). On a bidding team the number lies for a different reason than it does in SaaS.
- GigRadar pipeline data for June 2026 (n = 65,838 proposals) puts the market-wide reply rate at 5.1%. Any quota built on 10% will miss by half before your bidders do anything wrong.
- Reply rate does not improve with volume. Teams sending 1,000+ proposals reply at the same rate as teams sending 51 to 100, so raising a send quota buys you spend, not conversations.
- Inside a single team, the best bidder out-replies the worst by 3.8 points at the median and 19.2 points at the extreme, on the same template. That is a routing problem, not an effort problem.
- Reply data takes 75 to 90 days to finish arriving, so a month-end attainment review is grading a photograph that is still developing.
43.6% of B2B reps hit quota last quarter, measured across 252 software companies and roughly 58,500 sales-professional ratings by RepVue's Cloud Sales Index.
Every article about quota attainment quotes that number and then prescribes the same five fixes: better enablement, cleaner CRM data, realistic quota setting, more coaching, smarter territory design.
None of that applies to an Upwork agency, because your team has no territory, no CRM-sourced pipeline, and no inbound. It has a scanner, a Connects balance, and a bidder pool.
I have watched agency owners set a "100 proposals a week per bidder" target, hit 104, and book two calls.
The quota was met. The month was still a loss.
Quota attainment is one number hiding two very different failures
The arithmetic is not where teams go wrong:
Two different measurements both get published under the name quota attainment. Participation is the share of reps who cleared 100%, which is what RepVue and The Bridge Group report, and average attainment is the share of quota the typical rep closed, which almost nobody publishes.
For a bidding pod the distinction decides where you look next. A pod at 43% with every bidder clustered near the same number has a target problem, and a pod at 43% with two bidders carrying the other four has a routing problem.
Most Upwork agencies I look at are the second kind and treat themselves as the first. The rest of this article is about how to tell them apart.
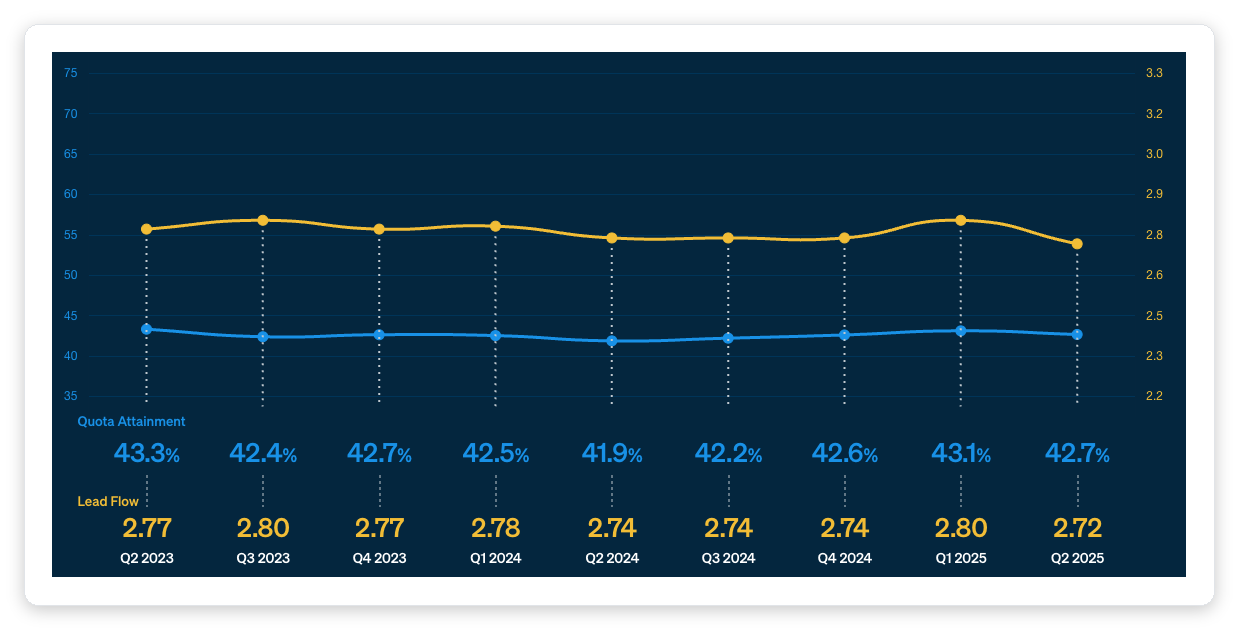
Nine consecutive quarters land inside roughly one point of each other.
Widen the window and it holds. Attainment troughed in Q2 2025, climbed for three quarters to a recent high of 44.22% in Q1 2026, then slipped back to 43.60%.
RepVue revises prior quarters as new ratings land, so every figure here is quoted from that quarter's own report. The decimals move a little between reports, the shape does not.
From Q3 2023 to today, across hundreds of companies, the number has not left a two-point corridor.
That is not a coaching outcome. It is a structural property of how targets get set.
| Source | Period | Figure | What it measures |
|---|---|---|---|
| RepVue Cloud Sales Index | Q2 2026 (latest) | 43.60% | Share of reps who met or exceeded quota, ~58,500 ratings at 252 companies |
| RepVue Cloud Sales Index | Q1 2026 | 44.22% | Share of reps who met or exceeded quota, recent high |
| RepVue Cloud Sales Index | Q2 2025 | 42.69% | Share of reps who met or exceeded quota, as published in the Q2 2025 report, ~47,000 ratings at 246 companies |
| The Bridge Group | 2026 | 48% | Share of AEs who achieved annual quota, down from 51% in 2024 |
| QuotaPath (on RepVue Q2 2025) | Q2 2025 | 57.31% | Share of reps who missed quota entirely |
RepVue and The Bridge Group are measuring the same thing on different panels and periods, which is why 43.6% and 48% can both be right. Neither tells you what the typical rep actually delivered, and neither was measured on anything resembling an Upwork pipeline.
Calculate the quota attainment your funnel can actually support
Before you argue about whether a bidder is underperforming, run the arithmetic on what their assigned activity can produce at your real conversion rates.
The reply-rate default is our June 2026 market-wide number and the connects default is our measured average per send. The pod size, send rate and reply-to-call rate are placeholders, so replace all three with your own once you have 90 days of settled data.
Interactive Tool
Enter your bidding pod's setup and the calculator back-solves attainment, the connect bill, and what each lever is actually worth. Connects default to 2 per send, roughly the platform-wide average we measure, and heavily boosted bids run far higher.
Three ways to close the gap
1. Buy the gap with volume
·
2. Earn the gap with reply rate
·
3. Route the gap to your best profile
·
Connects priced at $0.15 each per Upwork's Connects documentation. The routing lever uses 1.9 points, half of the 3.8-point median best-versus-worst within-team spread, because routing moves a pod from its average profile to its best rather than from its worst to its best (GigRadar pipeline data, Dec 2025 to Feb 2026, n = 133,872 proposals).
If the calculator returns under 70% on your current setup, stop the performance conversation. You assigned a number your funnel cannot produce, and no amount of coaching changes arithmetic.
Nobody scales their way to a better reply rate
The reflex when attainment slips is to raise the activity target. Our data says that buys volume and nothing else.
Across 133,872 proposals sent between December 2025 and February 2026, median per-team reply rate flattens after the first 50 proposals and stays flat forever.

| Proposals sent, Dec 2025 to Feb 2026 | Teams | Avg team reply rate | Median team reply rate |
|---|---|---|---|
| 11 to 50 | 90 | 8.6% | 6.3% |
| 51 to 100 | 77 | 7.4% | 7.1% |
| 101 to 250 | 127 | 7.7% | 6.8% |
| 251 to 500 | 122 | 7.5% | 7.0% |
| 501 to 1,000 | 60 | 7.6% | 6.2% |
| 1,000+ | 13 | 7.6% | 6.7% |
Source: GigRadar pipeline data, December 2025 to February 2026 (n = 133,872 proposals).
A team at 1,000+ proposals in the window converts at 7.6%. A team at 51 to 100 converts at 7.4%.
Ten times the volume, no conversion advantage.
This is cross-sectional, so read it as "teams that send more do not reply better" rather than "sending more lowers your rate."
The marginal bid is worse than the average bid
When a bidder stretches to hit a raised number, the extra proposals come from the crowded end of the pond. We can measure exactly how crowded, because we can see when several GigRadar customers bid on the same job.
Two thirds of proposals already land on jobs another GigRadar team is bidding, and those are only the competitors we can see. The proposals you add to hit a stretched quota are, by construction, the ones your scanner ranked lowest and everyone else's scanner ranked highest.
This is why bidding strategy beats bidding volume once you are past the first hundred sends a month.
Your worst bidder is not lazy, they are wearing a worse envelope
Across 61 multi-freelancer teams, we measured the reply-rate gap between each team's best and worst bidder.
Those bidders sent the same template, off the same scanners, to the same kinds of jobs.
What is left is the envelope: the Upwork profile the client sees in the inbox preview. Photo, headline, Job Success Score, badge state, hourly rate, visible portfolio.
Ranked across 183 freelancer profiles with at least 100 proposals each, reply rate runs from 0.6% at the bottom to 17.8% at the top. The 90th percentile profile out-converts the 10th by 5.4 times.
Give your weakest bidder a quarter of profile milestones instead of a send target: a niche headline that matches the scanner, a JSS repair plan, a better photo, two portfolio pieces in the target subcategory. An agency profile review moves attainment further than another proposal-writing session.
The routing math nobody runs
Take a three-bidder pod replying at 25%, 13% and 6%, sending 100 proposals a week split evenly. That produces about 14 replies a week.
Route all 100 through the 25% profile and you get 25 replies. Same template, same jobs, same connect spend, 78% more conversations.
Pull reply rate per freelancer profile over a cured 90-day window, minimum 50 proposals each. Fewer than 50 and you are reading noise.
Weight the scanner mix toward the top profile. Partial routing at that ratio lifts weekly replies 30% to 50% on a typical spread.
Each freelancer account has its own Connects balance and availability. Full concentration hits that wall, which is why 60 / 30 / 10 beats 100 / 0 / 0 in practice.
A send quota is a spend quota wearing a costume
Every proposal costs Connects, and Connects cost $0.15 each on Freelancer Plus and Agency Plus alike. A send target is therefore a budget commitment you made without writing a budget.
Run your own bid mix through Upwork's Connects calculator before you sign off on a number. A standard job takes far fewer Connects than a boosted bid in a saturated category, so two bidders on the same send quota can differ threefold in spend.
The cost of one replied conversation varies more than six times across subcategories, at the same connect price.
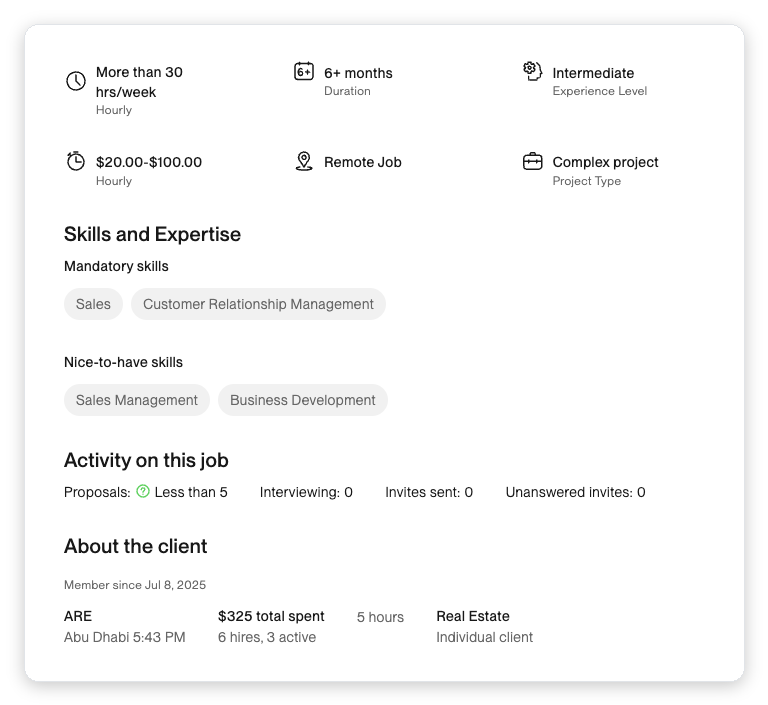
A bidder chasing a send target scrolls past that panel. A bidder graded on cost per reply reads it, because it is the only thing standing between them and a $53 conversation.
| Subcategory | Proposals (n) | Connect cost per reply |
|---|---|---|
| Other, Accounting & Consulting | 1,554 | $8.28 |
| Video & Animation | 17,808 | $9.55 |
| Lead Generation & Telemarketing | 15,816 | $10.24 |
| Marketing, PR & Brand Strategy | 10,164 | $12.82 |
| Web & Mobile Design | 116,664 | $34.88 |
| Web Development | 222,594 | $36.64 |
| QA Testing | 8,022 | $53.04 |
Source: GigRadar pipeline data, December 2025 to February 2026, Connects priced at $0.15. These dollar figures come from a wider proposal set than the category reply rates quoted elsewhere in this article, so use them to compare segments against each other rather than to back-derive a reply rate.
A bidder who hits 100 of 100 sends in QA Testing burns more budget per conversation than a bidder at 60 of 100 in Video and Animation. A send-count scoreboard ranks the first one higher and promotes their habits.
Grade on connect cost per reply instead, with a ceiling per bidder. Start the ceiling at $20 and tighten it each quarter, and read our Connects cost-per-hire breakdown for the downstream version of the same math.
You are grading a month that has not finished happening
Reply data arrives late. Measured on one snapshot date, proposals aged 45 to 60 days showed a 4.5% reply rate while proposals aged 75 to 90 days showed 9.6%.
Read the whole curve before you use it, including the part that does not flatter the story.
| Days since the proposal was sent | Proposals (n) | Observed reply rate |
|---|---|---|
| 45 to 60 | 14,416 | 4.5% |
| 60 to 75 | 25,799 | 5.5% |
| 75 to 90 | 22,203 | 9.6% |
| 90 to 105 | 25,979 | 9.6% |
| 105 to 120 | 17,475 | 7.6% |
| 120 to 135 | 5,083 | 7.0% |
| 135 to 150 | 22,917 | 7.0% |
Source: GigRadar pipeline data, proposals sent December 2025 to February 2026, measured on 2026-04-26.
These are different cohorts on one snapshot date, not the same proposals tracked over time, and the tail falls back to 7% rather than holding at 9.6%. Part of the climb is replies still arriving and part is the older cohorts simply being different, which is exactly why you compare like-aged windows instead of adjacent calendar months.
The month-end ritual compares a 30-to-60-day-old month against a 60-to-90-day-old month. The older one has had more time to collect replies, so the current month starts at a disadvantage no bidder can close.
Owners have coached, demoted and fired people over that artifact. The fix is two scoreboards on two different clocks.
Proposals sent, connect spend, scanner-mix compliance, response time to a reply. All complete the day they happen.
Reply rate, replies per dollar, calls booked, close rate. Draw the window from data 75 to 165 days old and publish the start date next to the number.
Our own market read follows the same rule. GigRadar pipeline data shows a market-wide reply rate of 4.6% in March 2026 (n = 86,043) and 5.1% in June 2026 (n = 65,838), and the June figure is still curing.
Free for Upwork agencies
Stop setting quotas on numbers you cannot see
GigRadar operates a real Upwork Business Manager account that your agency invites in through Upwork's native invitation flow. Proposals submit from our BM under our team's supervision, your freelancer account is never touched, and every send lands in one pipeline view with reply rate per profile, per scanner and per category.
Get Your Free Agency Audit →How to set a bidding quota that can actually be hit
Five steps, in order. Each one takes an afternoon.
Start at revenue, divide by average contract value, divide by close rate, divide by reply-to-call rate, divide by reply rate. The proposal target is whatever falls out, not 100 because 100 sounds like effort.
If the back-solved target costs more in Connects than the pipeline it produces is worth, the answer is a narrower scanner, not a bigger number. Volume becomes a budget you spend down.
Sends, first-response time, scanner compliance and connect spend belong to the bidder. Reply rate belongs to the profile and the targeting, so it belongs to you.
At 8.3% in Sales & Marketing and 3.5% in Web, Mobile & Software Dev, one blended target is generous to one pod and punitive to the other.
Recalculate the funnel rates every quarter from the 75-to-165-day window, then reset the target. A quota built on last year's reply rate is a fiction with a spreadsheet attached.
The bidder scorecard we use
Paste this into your weekly pod review. It separates the two clocks so nobody argues about a half-cured month again.
The quota clause that routes your team into the worst jobs
Plenty of agencies add a quality gate to the quota: only bid jobs above an 80% match score. That clause inverts.
In our data, jobs in the top decile of scanner-match score reply at 5.2%. Jobs in the bottom decile reply at 8.2%.
Match score is not deal quality, it is competition density. A job your scanner loves is a job every other agency's scanner loves too, which lands you back on the right-hand side of the crowding chart above.
"High-quality bids only, minimum 80% match." Replace it with a targeting rule you can defend: payment-verified client, budget floor, posted under an hour ago, category on your pod's list. See our healthy pipeline checklist for the full filter set.
Take the benchmarks with you
Download the funnel benchmarks below and drop them into your quota model. The rates are the defaults in the calculator above.
Reply rate by category, cost per reply by subcategory, and the curing curve, as one CSV.
What I would change first
If your attainment is under 70%, do not touch the target this month. Pull reply rate per profile over a cured window and look at the spread.
If the spread is above five points, you have a routing problem worth 30% to 50% more replies at zero extra spend. That is a bigger number than any coaching plan will produce, and it takes one afternoon of scanner reassignment.
If the spread is tight and everyone is low, the target was never reachable. Rebuild it from the funnel rates, cap it at the connect budget, and tell the team the old number was yours, not theirs.
Freeze the target. Pull reply rate per profile on a cured window and measure the spread before anyone gets a performance conversation.
Routing problem. Reweight the scanner mix 60 / 30 / 10 toward the strongest profile and put the weakest bidder on profile milestones for a quarter.
Target problem. Rebuild the number from your funnel rates, cap it at the connect budget, and say out loud that the old number was yours.
For the operating layer underneath all of this, our pipeline ops guide covers the weekly cadence, and the KPI set covers what else belongs on the board. If you want the funnel instrumented without building it yourself, GigRadar's plans start with the audit.