
Net Promoter Score Calculator: Why Your NPS Is Mostly Noise. A 2-minute walkthrough of the margin-of-error math, the 2026 agency benchmarks, and what to track instead. Watch on YouTube
TL;DR
- The Net Promoter Score calculator below gives you your score and its 95% confidence interval. Almost no other calculator shows the second number, which is the one that decides whether your score means anything.
- At 12 responses, an NPS of 42 has a confidence interval of roughly -1 to 85. Your "42" is statistically indistinguishable from zero.
- To measure your NPS to within ±5 points you need roughly 800 responses. No agency running 2 to 20 freelancers has a client list that long.
- The claim that NPS predicts growth better than other metrics failed peer-reviewed replication (Keiningham et al., Journal of Marketing, 2007). It is a feedback prompt, not a forecasting instrument.
- If you sell on Upwork, a better-weighted satisfaction score already exists. Job Success Score is weighted by contract earnings and relationship length, and buyers actually see it.
- With 12 to 40 clients, track repeat-contract rate, referral count, and named defects instead. Those are countable events, not sampled opinions.
An agency with 40 clients and a 30% survey response rate collects 12 answers. Run those 12 answers through a Net Promoter Score calculator and you might get a 42.
The 95% confidence interval on that 42 runs from -1 to 85. You cannot tell whether your clients love you or are neutral about you, and no amount of dashboard styling fixes it.
I have watched a lot of agency owners screenshot an NPS number into a board deck. Almost none of them have ever seen the error bars on it.
So the calculator below prints both.
Calculate your NPS, and the margin of error nobody shows you
Enter how many clients gave each rating. The tool returns your score, your sample size, the 95% confidence interval, and a plain verdict on whether the number is usable.
Interactive Tool
Net Promoter Score Calculator with Confidence Interval
Promoters rate 9 to 10, passives rate 7 to 8, detractors rate 0 to 6.
The formula is trivial. The part every other calculator skips is not
Net Promoter Score comes from one question: how likely are you to recommend us, on a scale of 0 to 10. Ratings of 9 and 10 are promoters, 7 and 8 are passives, and 0 through 6 are detractors.
The score is the percentage of promoters minus the percentage of detractors, which produces a number between -100 and +100. Passives count toward your total but never toward your score, which is the first thing that surprises people.
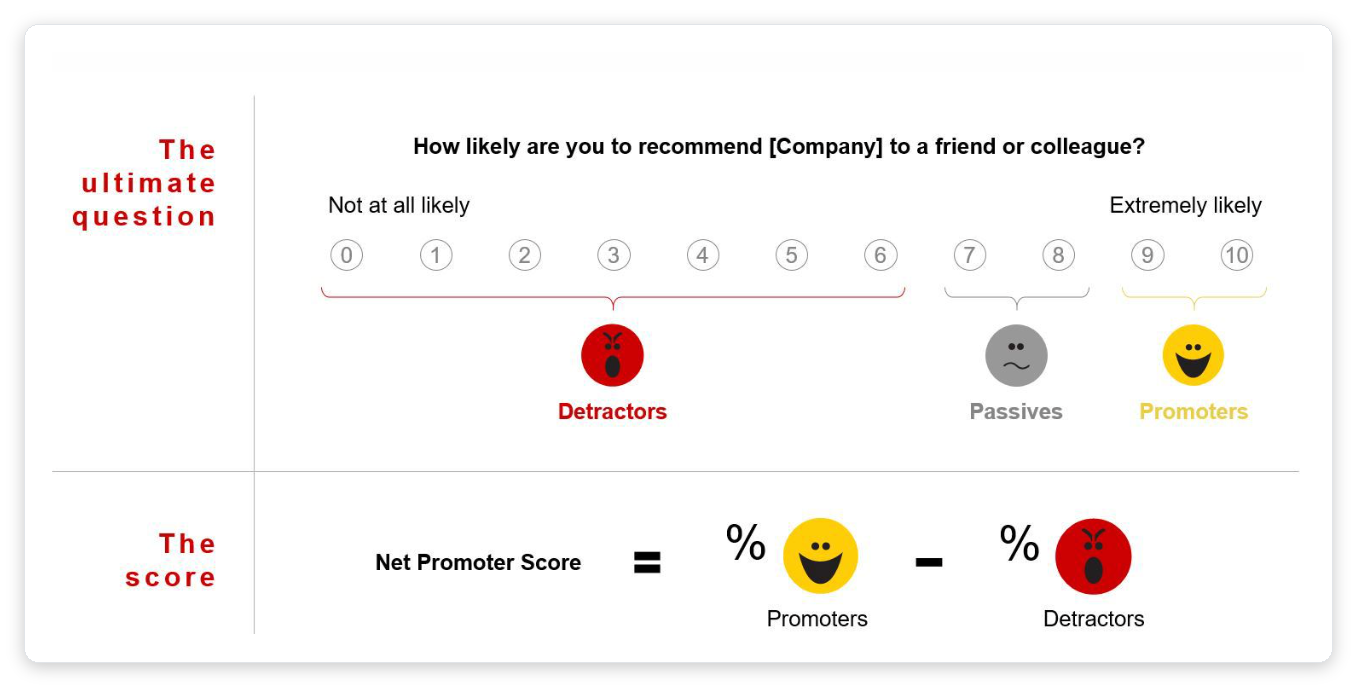
The two formulas
And the one that decides whether the first one means anything:
The second formula is standard survey statistics, documented in MeasuringU's sample-size guidance for NPS confidence intervals. The n in the denominator is why small agencies are stuck.
Notice where n sits. It is under a square root in the denominator, so cutting your error in half requires quadrupling your responses.
That single fact is the whole problem for a 15-person agency.
Why your score jumps 20 points when nothing actually changed
Here is the same underlying client base measured at different sample sizes, holding the promoter and detractor mix roughly constant. Only the number of responses changes.
| Responses (n) | Reported NPS | Margin of error | True score is somewhere in |
|---|---|---|---|
| 12 | 42 | ±43 | -1 to 85 |
| 20 | 45 | ±32 | 13 to 77 |
| 30 | 47 | ±26 | 21 to 73 |
| 50 | 46 | ±20 | 26 to 66 |
| 100 | 46 | ±14 | 32 to 60 |
| 200 | 46 | ±10 | 36 to 56 |
| 400 | 46 | ±7 | 39 to 53 |
Calculated with the standard NPS variance formula at 95% confidence, holding the promoter and detractor proportions near constant. Reproduce any row in the calculator above.
An agency that "improved from 38 to 52 this quarter" on 20 responses improved by nothing measurable. Both numbers sit comfortably inside the other one's error bar.
This is not a niche statistical objection. It is the first thing anyone with a statistics background says when an operator describes their sample size.
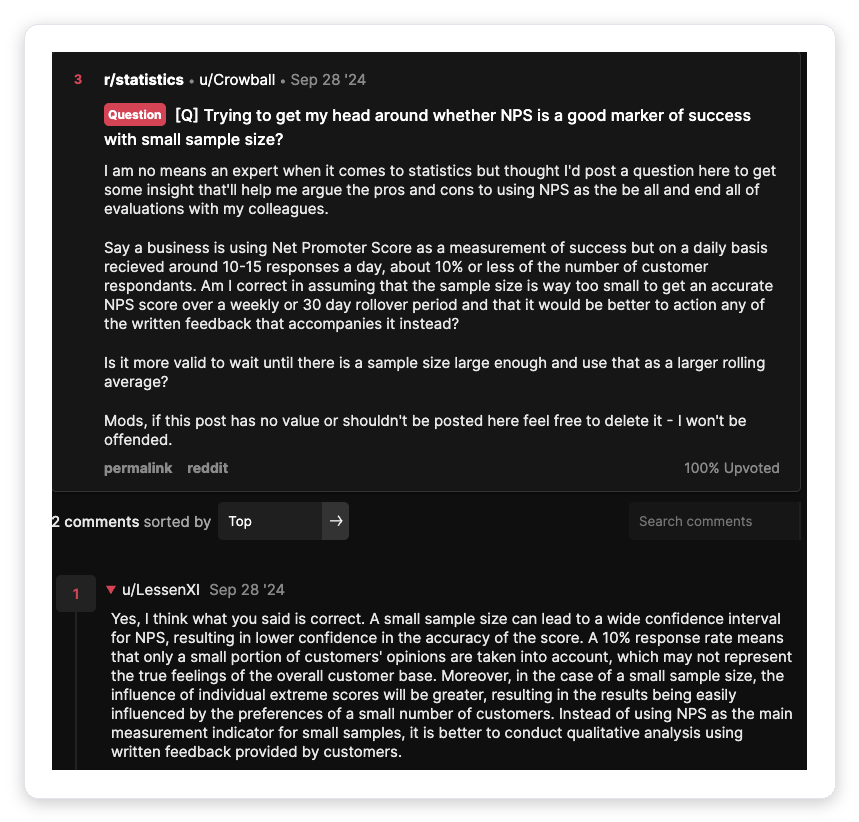
Tracking the trend does not rescue it. Tracking the trend is worse.
The standard defence is "ignore the absolute number, just watch your own movement over time." That advice is backwards, and it is the single most expensive misconception in this whole topic.
Comparing two noisy scores is harder than estimating one, because the variance of a difference is the sum of the two variances.
Your error bar does not cancel out. It compounds.
This is not only theory. Research published in the International Journal of Market Research found that the promoter-minus-detractor counting method introduces additional variation compared to simply averaging the same 0-to-10 answers, both across brands and for the same brand across survey waves.
Trend-tracking is where NPS performs worst, not where it gets rescued.
Survey tools that display NPS as a single large number with a trend arrow are showing you the arrow of random sampling noise. Ask any vendor dashboard to show you its confidence interval, and watch how few can.
The subtraction is the bug
Every calculator on page one of Google treats promoters minus detractors as the goal. That arithmetic step is where the information gets destroyed.
Researchers tested exactly this, comparing NPS against six alternative ways of calculating a score from the identical underlying answers. The sample was 193,220 responses across seven brands.
"While NPS performs well in a comparative assessment of calculation methods, 'top-box' metrics perform better, undermining claims that NPS is the one number managers need to grow."
Baehre, O'Dwyer, O'Malley & Story, "Customer mindset metrics," Journal of Business Research (2022)
Top-box means counting your promoters and stopping there. No subtraction, no bucketing.
Two structural problems make the subtraction expensive at agency scale.
Every 7 and 8 you collect is multiplied by zero. Collect 20 answers with 7 passives among them and your score is computed from 13.
The client mildly annoyed about a slow Slack reply and the client drafting a dispute both register as a single detractor.
The defence is that the 0-6 and 9-10 cutoffs capture a real nonlinearity in how satisfaction turns into behaviour. That nonlinearity was asserted by inspection, never validated, and when it was finally tested against simpler treatments of the same data it lost.
The growth claim behind NPS did not survive replication
NPS was introduced by Fred Reichheld in 2003 as "the one number you need to grow." That framing is why it ended up in every board deck.
Then people tried to reproduce it.
"We find no support for the claim that Net Promoter is the ‘single most reliable indicator of a company’s ability to grow.’"
Keiningham, Cooil, Andreassen & Aksoy, "A Longitudinal Examination of Net Promoter and Firm Revenue Growth," Journal of Marketing 71(3), 2007, Discussion section, p. 45
The authors replicated the Net Promoter analyses using longitudinal data from 21 firms and more than 15,500 interviews in the Norwegian Customer Satisfaction Barometer.
Measured against the American Customer Satisfaction Index, NPS did not perform better. The paper went on to win the Marketing Science Institute's H. Paul Root Award.
A later reassessment in the Journal of the Academy of Marketing Science found something more specific, and it matters for you. NPS did predict sales growth, but only the brand-health variant that surveys all potential customers (Baehre, O’Dwyer, O’Malley & Lee, 2022).
The transaction-based variant, the one where you email your own existing clients after a project, is precisely the version that did not hold up. That is the exact survey almost every agency runs.
NPS is the single most reliable predictor of company growth.
No study outside the original has confirmed NPS is superior to other customer metrics at predicting growth.
None of that makes the survey worthless. It makes the score a poor instrument and the free-text answer underneath it the actually valuable part.
2026 agency benchmarks, and why you cannot compare yourself to them
These are the current published benchmarks. Read them, then read the column that matters.
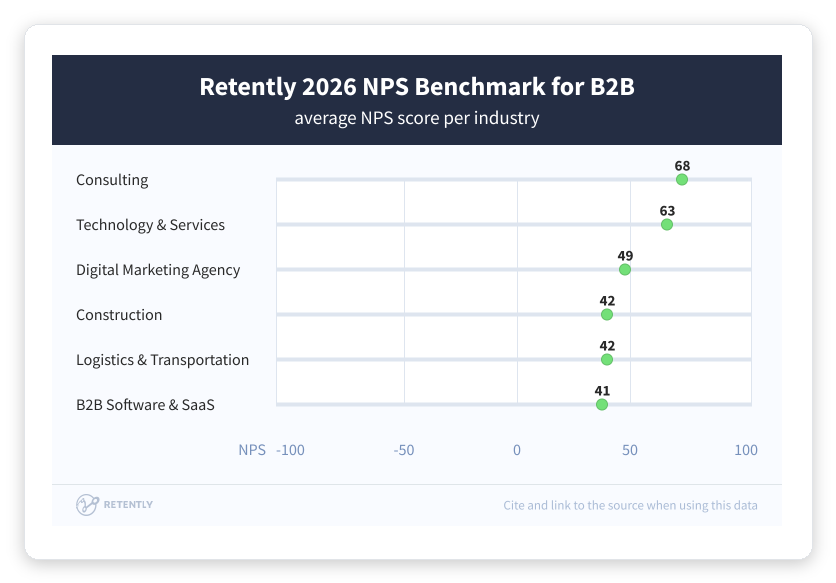
| Segment | 2026 average NPS | Responses you need to prove you beat it |
|---|---|---|
| Consulting | 68 | ~90 (to resolve ±15) |
| Digital marketing agencies | 49 | ~90 (to resolve ±15) |
| Financial services | 68 | ~90 (to resolve ±15) |
| Logistics and transportation | 42 | ~200 (to resolve ±10) |
| B2B software and SaaS | 41 | ~200 (to resolve ±10) |
Benchmarks from Retently's 2026 NPS benchmark study, which puts B2B industries in a 41 to 68 band and shows digital marketing agencies sliding from 51 in 2025 to 49 in 2026. Response requirements are calculated from the variance formula above at a 60/26/14 promoter/passive/detractor mix, matching the earlier table, so your own figure moves with your split.
The 2-point drop in the agency benchmark between 2025 and 2026 is widely reported as a trend. Across thousands of firms that is probably real, but no individual agency in that dataset could have detected a 2-point move in its own score.
If you sell on Upwork, a better-built satisfaction score already exists
Before you build a survey program, look at the score Upwork is already computing on you. It is constructed better than anything you would run by email.
Upwork's Job Success Score is built from client feedback, contract-ending history, and long-term client relationships, and an agency's JSS aggregates across all of the agency's jobs.
Three of its weighting rules are the ones your own survey will never have.
Jobs with higher earnings have a bigger impact, amplifying both the upside and the damage. Your survey counts a $200 client and a $20,000 client identically.
Every 90 days with payment counts as an extra job toward your JSS, up to a maximum weight of 8 jobs. A two-year retainer carries the weight of eight strong outcomes.
Contracts with clients you have worked with longer than 90 days are automatically considered successful, even if the contract ends with no feedback at all.
All three rules are documented on Upwork's Job Success insights page.
Now compare that to the survey you were about to send.
| Property | Your email survey | Upwork's Job Success Score |
|---|---|---|
| Who responds | Whoever bothers to reply, self-selected | Collected at contract close, in the platform |
| Revenue weighting | None | Higher-earning jobs weigh more |
| Relationship weighting | None | Up to 8 jobs of weight for a long retainer |
| Commercial consequence | None | Buyers see it when choosing a freelancer |
Upwork's help pages have historically described a private, client-only feedback score alongside the public star rating, and the Job Success insights page still notes that private feedback can differ from public. The exact mechanics have been rewritten more than once, so treat any blog post quoting a specific private-feedback question as potentially stale, including the ones ranking for this topic. Every Upwork claim in this section was verified against Upwork's own help pages on 20 July 2026.
One caveat that matters for the audience of this article: Upwork notes that Job Success insights is not yet available for agencies or exclusive agency freelancers. You get the score, not the diagnostic breakdown behind it.
A contract where the client leaves no feedback becomes ineligible for your JSS entirely, unless it is a long-term relationship. Chasing feedback at close is therefore worth more than any survey program you could build, and I covered the mechanics in the Job Success Score and badges guide.
The retainer point deserves its own line. A long-running contract is not just better revenue, it is a structural positive in the only satisfaction score that buyers actually see (worth reading alongside how to price retainers).
The one part of your own survey worth keeping
Send the survey. Then ignore the number and read the comments.
A detractor who writes "your reporting is late every month" has handed you a specific operational defect, and that sentence is worth more than any score computed from it. The 0-to-10 rating is a routing mechanism for getting people to write that sentence.
"What is the single thing we would need to fix for you to rate us higher?" A required free-text field turns a useless sample into a defect list.
Repeat-contract rate and referral count are censuses of what actually happened, not samples of what people say they might do. They have no margin of error.
At your sample size a single detractor moves your score by 8 points or more. That is statistically meaningless and commercially urgent at the same time.
If it goes in a deck, write "NPS 42, 95% CI -1 to 85, n=12." Anyone who reads that immediately understands what to do with it.
At 12 to 40 clients you do not have a population to sample, you have a roster you can phone. Replace the survey with a one-row-per-client register (revenue share, contract end date, last real conversation, and a green or at-risk flag set by whoever owns the relationship), and here is how to ask for the feedback that feeds it.
Free for Upwork agencies
Measure cost per client, not mood
Agencies that track CAC and LTV per channel keep finding the same thing: Upwork is their cheapest acquired client. GigRadar runs end-to-end Upwork bidding through our own Business Manager account, so you can put a real cost-per-acquired-client figure next to every other channel you pay for.
Get Your Free Agency Audit →What to track instead when you have 30 clients
Every metric below is a count of something that happened, so none of them carry sampling error. They are ordered by how quickly they tell you something you can act on.
| # | Metric | Why it beats NPS at your size |
|---|---|---|
| 1 | Repeat-contract rate | Counts every client, not a self-selected 30%. Rehiring is the behaviour NPS only asks about. |
| 2 | Referral count per quarter | An actual recommendation, which is what the NPS question is a proxy for. |
| 3 | Net revenue retention | Weighted by money, so your largest account cannot hide behind nine small happy ones. |
| 4 | Job Success Score | Upwork collects it on nearly every closed contract, and buyers actually see it. |
| 5 | Named defects from free-text | A list of things to fix. Never a number, always actionable. |
Net revenue retention is the one most agency owners skip, and it is the closest thing to a single honest number about client health (full breakdown here).
If your repeat-contract rate is the problem rather than your delivery, the fix is upstream in acquisition, not in a survey. Our client retention playbook and referral program guide both cover that ground, and the CAC calculator tells you what each replacement client is costing you.
Run this in 20 minutes, once a quarter
This is the whole process. It fits in a single afternoon and produces a defect list rather than a vanity number.
The 0-to-10 rating plus one required free-text field. Send it from your own address, not a survey tool's domain.
Download the CSV. Record the interval and the sample size next to the score, permanently.
One line per complaint. Duplicates get a tally mark, and the tally is your actual priority ranking.
At 12 responses you have maybe two of them. Two calls is not a research program, it is a Tuesday.
The score you get from this is still noise. The defect list is not, and that asymmetry is the entire point.
Measure what happened, and read what people wrote.
Then keep the top of the funnel full, so that one unhappy client is an inconvenience rather than a quarter-ending event.