
Go To Market Plan Template: The 5 Numbers That Decide It The 2-minute walkthrough of the capacity ceiling, the segment gate, and the channel math behind a 90-day plan. Watch on YouTube
TL;DR
- Take any downloadable go to market plan template and fill it in while your delivery team is booked solid for 90 days. Every field still works, and that is the bug.
- An agency GTM plan is a constraint document, not a strategy deck: capacity ceiling, price floor, qualified conversations per week, kill number, kill date.
- Segment beats channel. Same platform, same two months, same bidding method: Sales & Marketing work replies at 8.43% and Web and Software Dev at 3.26% (GigRadar pipeline, Jun to Jul 2026, n = 127,108).
- Score channels on qualified conversations per week (touch ceiling × reply rate × share of replies with a budget already approved), not on reply rate alone.
- The builder below turns 7 inputs into your revenue ceiling, price floor, weekly conversation target, and a copyable one-page 90-day plan.
Open any go to market plan template you can download today. Fill it in honestly, but assume one thing: your delivery team is fully booked for the next 90 days.
Every field still works. The ICP section, the positioning statement, the channel plan, the launch timeline, the KPI dashboard, all of it fills in cleanly.
Meanwhile the business it describes has zero ability to take on a new client.
That is the whole problem. These templates were built for companies that have to manufacture demand for something they have not shipped yet.
An agency does the opposite: it sells capacity into demand that already exists.
So the template optimises the wrong side of the equation, and the fields that would have stopped you (available billable hours, your price floor, how many funded conversations one channel can physically produce in a week) are not on it.
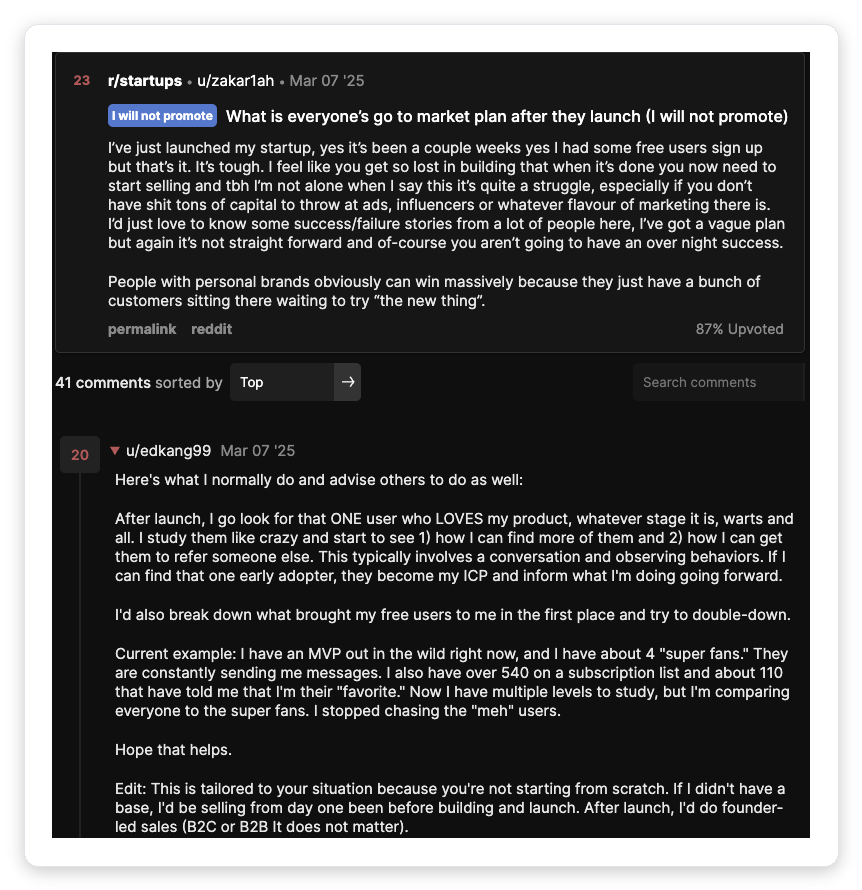
The top reply does not hand him a better template. It tells him to go find the one user who already loves the thing and work outward from there, which is the segment gate below, arrived at the hard way.
The five numbers your go to market plan template should force you to compute
A GTM plan for a 2 to 20 person agency does not need a market-sizing section. It needs five arithmetic gates, each one capable of telling you the plan is impossible before you spend a quarter proving it.
Everything else on the standard template is decoration you will never open again.
Billable hours available in the next 90 days, divided by average hours per project. That number caps revenue: it is a ceiling, not a goal.
Your last 20 closed projects ranked by realised gross margin, where the top quartile with at least 3 projects in it is your ICP. Anything with fewer projects is a hypothesis, and hypotheses need gate 4.
Weekly touch ceiling × reply rate × share of replies where a budget already exists. Multiplied out honestly, most channel plans collapse to under two real conversations a week.
Every positioning line and every segment guess carries a date and a threshold. "40 intent-verified proposals by day 21, under 4 replies means this positioning is dead."
Fully loaded cost per billable hour (bench time included) × estimated hours × (1 + historical overrun), divided by one minus target margin. Below this number a signed project destroys value.
If your revenue goal is larger than heads × billable hours × rate, the document you are writing is a hiring plan wearing a GTM plan's clothes. Say so on line one, or the plan will quietly fail on delivery instead of on sales.
Build your 90-day plan with the free GTM plan builder
Seven inputs. The builder returns your revenue ceiling, your price floor, the number of qualified conversations you need every week, and a copyable one-page plan with kill dates attached.
Free interactive tool
Defaults are set for a 6-person agency. Change them to yours.
Capacity is the ceiling your revenue goal has to fit under
The standard template has a revenue target and a launch timeline. It has no denominator.
That works for software, where demand is scarce and supply is elastic. It is backwards for services.
The failure mode here is not a dry pipeline. It is closing three projects in one week with one senior developer free.
You then deliver all three badly and burn the referral base that produced them. The GTM plan never sees this coming because capacity appears nowhere on it.
| Line | 6-person agency | Where it comes from |
|---|---|---|
| Billable hours, next 90 days | 1,800 | 5 delivery heads × 25 billable hrs/wk × 13 wks (allow for bench) |
| Average hours per project | 140 | Actuals, not estimates |
| Maximum deliverable projects | 12 | 1,800 ÷ 140 |
| Revenue ceiling at $9k average | $108,000 | Not a target. A physical limit |
| Conversations needed at 20% close | 60 | 12 ÷ 0.20, about 4.6 per week over 13 weeks |
Under five qualified conversations a week is the actual GTM requirement for this agency. Not "build brand awareness in the mid-market", just 4.6 conversations.
Once you have that number, most of the channel debate settles itself, because only some channels can produce five funded conversations a week at this headcount. Our breakdown of utilisation rate for agencies covers how to get an honest billable-hours figure rather than a flattering one.
Your ICP is hiding in your last 20 invoices, not in a TAM slide
Top-down market sizing is a funded-company instrument. It buys the right to be wrong for 18 months, which is a luxury priced in venture capital.
The failure statistic everyone quotes at you measures exactly those companies. CB Insights analysed 431 venture-backed companies that shut down since 2023 and found 43% cited poor product-market fit, with 70% listing "ran out of capital" as the proximate cause.
Agencies do not usually die that way. They drift into low-margin segments and suffocate with a full calendar at 12% gross margin, which is a different disease with a different test.
The replacement for the TAM field is a table you can build in 40 minutes from your invoicing tool and your time tracker.
| Segment | Projects | Realised gross margin | Hours overrun | Verdict |
|---|---|---|---|---|
| Shopify apps for DTC brands | 6 | 54% | +8% | ICP |
| Marketing sites for local services | 7 | 31% | +34% | Volume filler |
| Custom CRM builds | 2 | 49% | +15% | Hypothesis (n < 3) |
| "AI integration" retainers | 5 | 11% | +61% | Stop selling |
The fourth row is the one that matters. It looks like growth on a revenue chart and it is destroying the business, and no positioning workshop will ever surface it because positioning workshops do not read time sheets.
If you want the persona fields as well, our ideal customer profile template handles the qualitative half. This table decides which of those personas you are allowed to keep.
Score channels by qualified conversations per week, not by reply rate
Every template asks you to pick three or four channels and set a target reply rate. Reply rate is the least movable term in the equation.
Cold email reply rates now sit in the low single digits. Prospeo, reporting Instantly's dataset, puts the current cohort at 3.43%, and Hunter's study of 31 million emails sent in 2025 lands at a 4.5% average with the outcomes increasingly polarised between senders.
Both numbers post-date Google and Yahoo's bulk sender rules, which landed in February 2024 and made volume-first sending a deliverability problem rather than a copy problem.
LinkedIn looks healthier per message, right up until you notice what the cap is on. Cold outreach there runs through connection invitations, and LinkedIn restricts accounts that hit its invitation limit, typically for a week, with the practical ceiling around 100 invitations per account per week.
Assume a generous 10% reply rate on accepted outreach and that is roughly ten conversations a week per account, permanently. The alternative lane, Sales Navigator InMail, is metered by monthly credits, so it is capped too, just in a different currency.
And "reply" is doing enormous work in these comparisons. A reply to a cold email usually means "who are you".
A reply on an intent-verified channel comes from someone who has already scoped a job and attached a budget to it.
| Channel | Weekly touch ceiling | Reply rate | Budget already approved | Qualified conversations / week |
|---|---|---|---|---|
| Cold email | 2,000 | 3.4% | ~15% | 10.2 |
| LinkedIn invitations | 100 | 10% (assumed) | ~25% | 2.6 |
| Upwork proposals | 100 | 7.45% | ~90% | 6.7 |
Cold email still wins the raw count, and the honest version of this table says so. It wins by sending twenty times more touches, at a much lower share of budgeted buyers, after a warmup period measured in weeks.
The Upwork row uses GigRadar's own baseline: 7.45% reply rate across 133,872 outbound proposals sent between December 2025 and February 2026, where a reply means the client opened a chat or a hiring room. Proposals cost Connects rather than mailbox infrastructure, at $0.15 per Connect.
The June to July 2026 numbers further down this page use a stricter reply rule (hiring room only) on a more recent window, so their absolute level runs lower. Compare rows within one of those datasets, never a row from one against a row from the other.
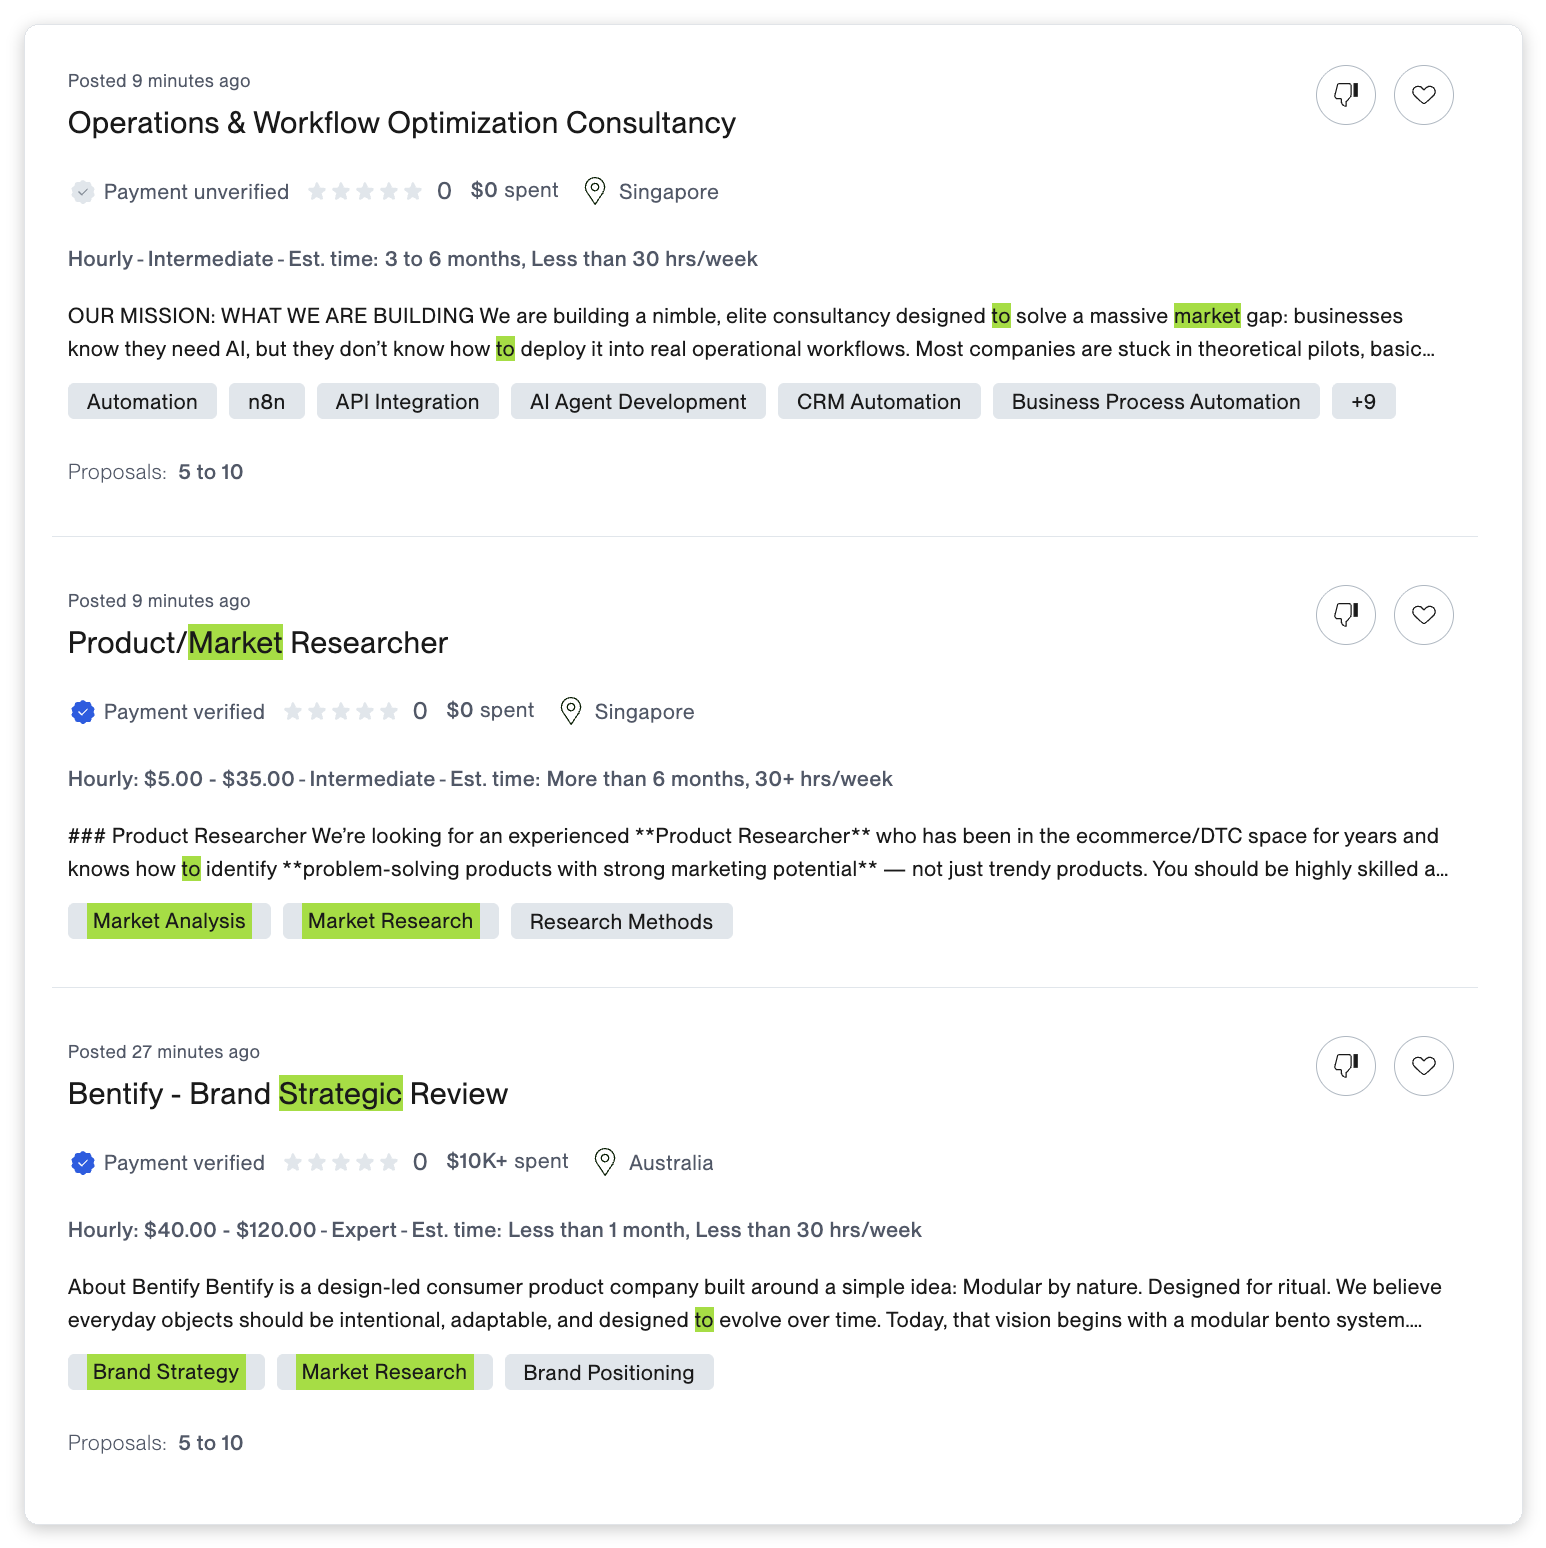
Note the second-order point in that screenshot: the buyers are advertising both the budget and the scope before anyone touches them. That is why the third column in the table above is so lopsided.
Upwork's own numbers say the same thing about buyer seriousness. In Q2 2026 the platform reported $966M in gross services volume and a record $5,230 in spend per active client, up 5% year over year on a shrinking client count.
Fewer buyers, each spending more. That is a harder market to spam and an easier one to bid into.
There is a fourth column no template has, and it decides whether the plan is real: whose hours does this channel consume? A channel that eats the founder's selling time competes directly with the capacity math from gate 1.
Our channel-by-channel reply rate comparison and the outbound sales strategy breakdown go deeper on cost per booked meeting.
Segment choice moves the number more than messaging does
Here is the part of GTM planning that gets one paragraph in most templates and deserves the whole first page.
Across GigRadar's pipeline in June and July 2026, the same bidding method on the same platform produced a 2.6× spread in reply rate depending only on which category the work sat in.
Sales and marketing projects replied at 8.43%. Web, mobile and software development, the most crowded category on the platform, replied at 3.26%.
The largest category by volume is the worst performing one. That is not a coincidence, it is what a crowded segment looks like when you measure it instead of describing it.
GigRadar's static analysis of 133,872 proposals (December 2025 to February 2026) found the same pattern one level deeper. Against that window's 7.45% mean, under-fished subcategories like lead generation and telemarketing (14.38%) and sales and marketing copywriting (14.24%) replied at roughly double, while the crowded web development subcategory sat below the mean at 5.80%.
Put the segment row above the messaging row in your plan. Rewriting a value proposition moves reply rate by fractions of a point, while moving from a saturated category to an adjacent under-fished one moves it by multiples.
The 12-week launch timeline is a fossil of the slowest channel
Standard templates set a 12 to 16 week launch cycle. In every one I have read, that length is inherited from product launches, where the build phase sets the clock.
You do not have one. Positioning costs nothing to change and can be tested in live sales conversations at zero marginal cost, so the only thing that legitimately takes time is accumulating enough touches to read a signal.
That duration is a property of the channel's base rate, not of your ambition.
| Channel | Touches for 4 expected replies | Realistic read time |
|---|---|---|
| Upwork proposals at 7.45% | 54 | 2 to 3 weeks |
| LinkedIn invitations at 10%, capped near 100/wk | 40 | 2 to 3 weeks, once acceptance lag is counted |
| Cold email at 3.4% | 118 | 2 weeks of sending, after 2 to 4 weeks of domain warmup |
Read that table again as a planning constraint. Choosing cold email as your first channel does not just cost money, it costs you the ability to learn anything about your positioning for roughly a month.
So every row in the plan gets a kill number and a kill date, on the same line as the hypothesis it tests.
A plan with no kill numbers is a wish with a Gantt chart attached. The point of the date is that it removes the decision from you on the day you will least want to make it.
Free for Upwork agencies
Run the channel that does not eat your selling hours
GigRadar operates a real Upwork Business Manager account, which your agency invites through Upwork's official invitation flow. Proposals submit from our BM under our team's supervision, and your own agency account is never touched.
Get Your Free Agency Audit →Your pricing section should output a floor, not a philosophy
Value-based versus cost-plus versus tiered is a dinner-party question. Agencies do not lose money because they picked the wrong pricing philosophy.
They lose money because they do not know the number below which a project destroys value, and they find that out after signing.
Two inputs are missing from every pricing section I have read: bench time (capacity you pay for and cannot bill) and historical hours overrun (estimate versus actual on the last ten projects, rarely under 20%).
Most owners who run this calculation discover their floor sits above their current rate card. Part of the existing book is negative-margin work they are actively selling more of.
That connects straight back to gate 1: capacity sold below the floor is worse than idle capacity, because idle capacity can still be redirected. Our retainer pricing breakdown and the Upwork agency pricing playbook cover rate-card construction once you have the floor.
The one-page go to market plan template, filled in
Companies that publish their real GTM work do not publish a strategy essay. They publish a mapping.
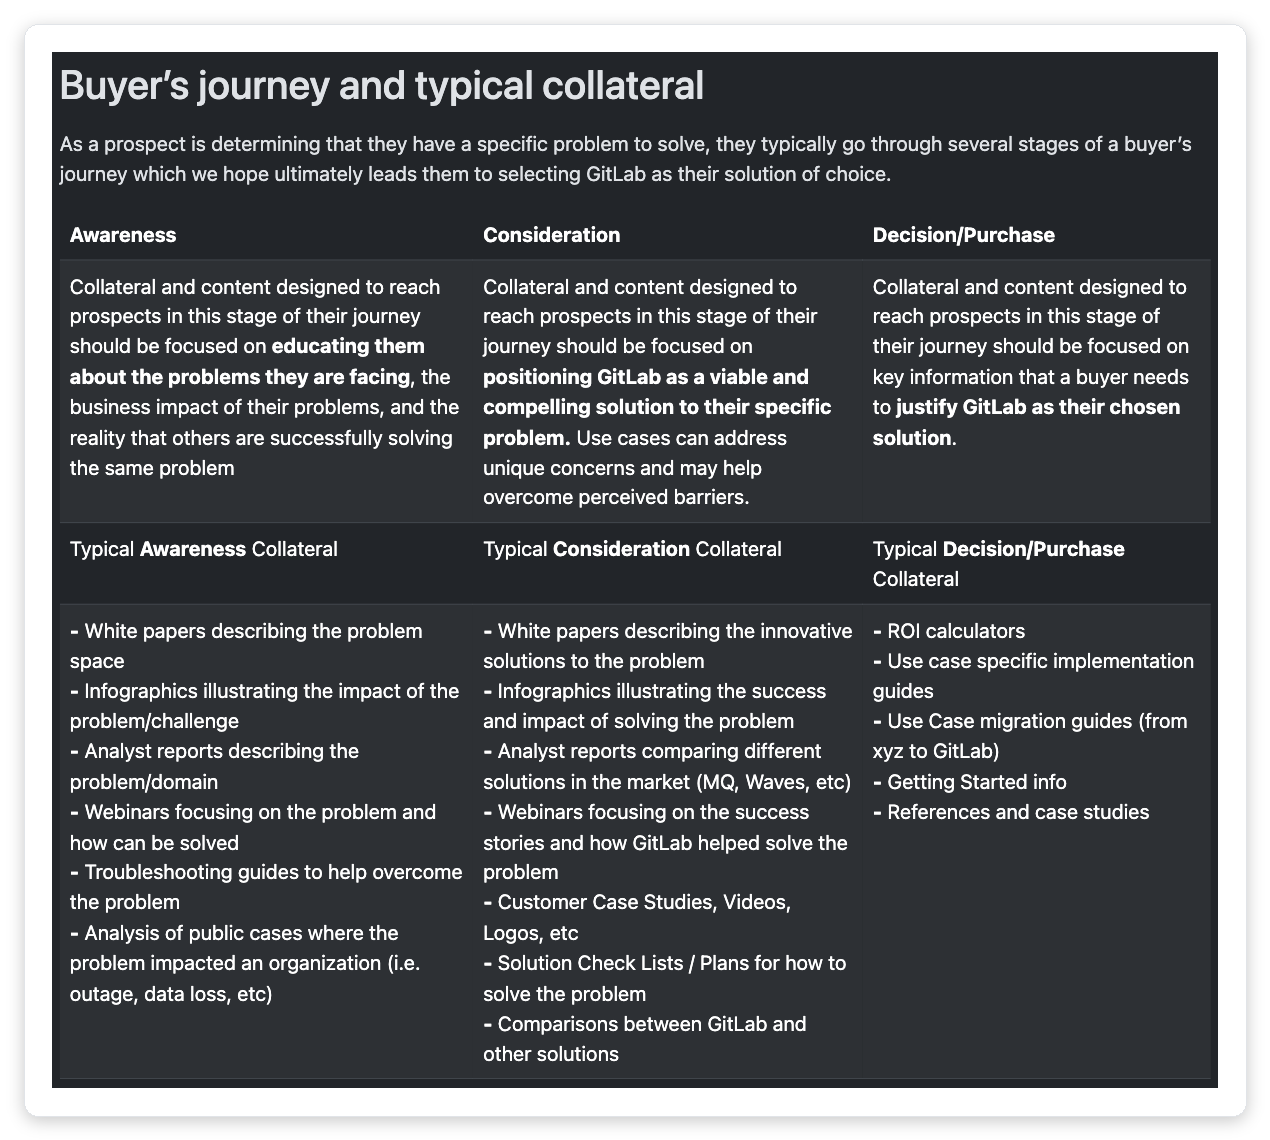
GitLab can afford that shape because it has a marketing team and a funded runway. Copy the discipline (every row produces an artefact), not the scale.
The agency version is the entire document below. If it does not fit on one page, the extra pages are decoration.
What the first 21 days actually look like
The plan above takes an afternoon to fill in. The first cycle takes three weeks, because that is how long the arithmetic needs.
Last 20 closed projects, with realised margin and hours overrun per project. This is the only research the plan requires.
Use the builder above. Write the kill numbers before you write a single line of copy.
Not three channels at 30% effort each. One channel, run to its weekly ceiling, so the sample is large enough to mean something on day 21.
Above the kill number, raise volume and keep the claim. Below it, the claim is dead, and the next hypothesis starts the same day.
Two cycles fit inside one quarter this way. The standard 12-week template gets you one, and it ends with a retrospective rather than a decision.
If Upwork is your first channel, our bidding strategy framework and the discovery call question set cover what happens after a reply lands. The plan is only the constraint layer.
Frequently asked questions about the go to market plan template
How long should a go-to-market plan be for a small agency?
One page, covering capacity ceiling, segment, channel math, kill numbers, and price floor. Longer documents are not more rigorous, they are just harder to disprove.
Do I need a TAM or market sizing section?
No. Market sizing tells you how big a market could be, while your last 20 invoices tell you which segment pays you profitably today.
What is a realistic time to first revenue from a new GTM plan?
On an intent-verified channel, 2 to 3 weeks to a readable signal and often a first contract inside 30 days. On cold email, add 2 to 4 weeks of domain warmup before the sample even starts accumulating.